|
Navigation
 This wiki
This page This wiki
This page
|
Rain-fed farming provides the bulk of the world’s food supply and has tremendous potential to increase its productivity to meet the 2015 hunger reduction target of the Millenium Development Goal (MDG). Water consumption around the globe has increased seven-fold in the course of the 20th century. Changes and innovations are needed in land, water and crop management but the efforts required to achieve this need to focus on increasing human and institutional capacity, build knowledge and improve management and infrastructure. These changes should also improve the livelihoods of rainfed farmers’ but large number of them are illiterate and how will they adopt innovations aided by ICT?
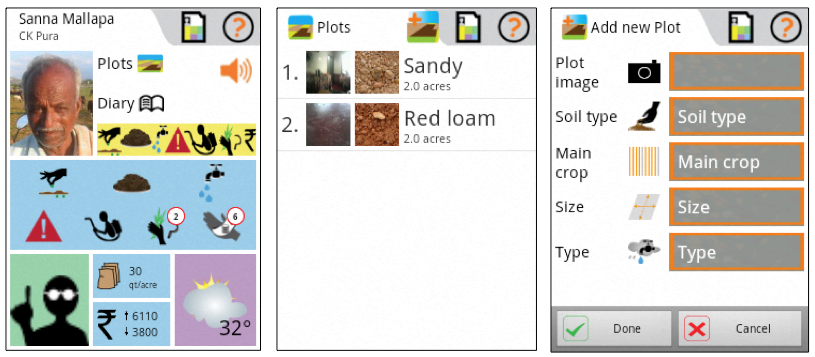
The Android phone application has the following functionality available from the main screen (see Figure 11):
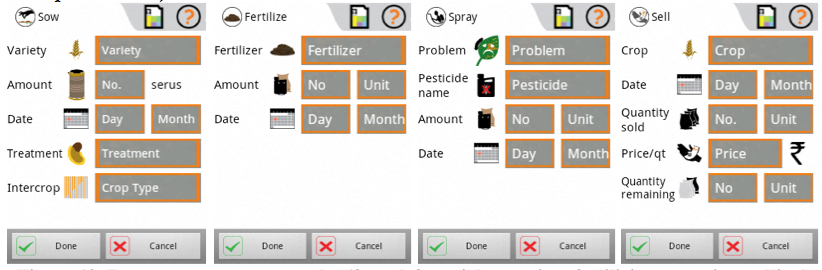
Figure 1: FarmBook user interface: main screen with Data EntryThe farmers could enter and share information about sowing, fertilizing, irrigating, problem reporting, spraying, harvesting and selling of crops (see Figure 12for example screens).
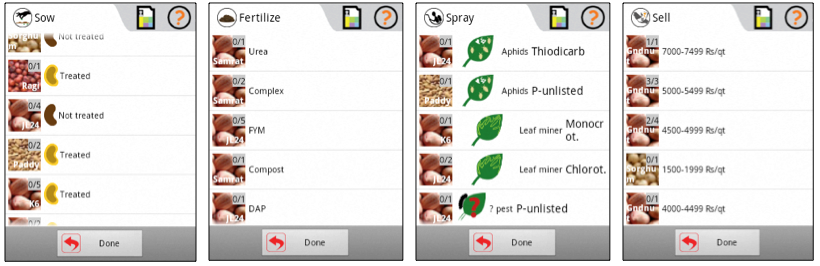
Figure 2: Data entry screen examples (from left to right: sowing, fertilizing, spraying, selling) Aggregate views of other farmers’ actionsThese screens allow farmers to see what actions other farmers have taken recently and throughout the season (see Figure 13). On tapping on a row in the interface the farmers would then see the details of the other farmers’ actions.
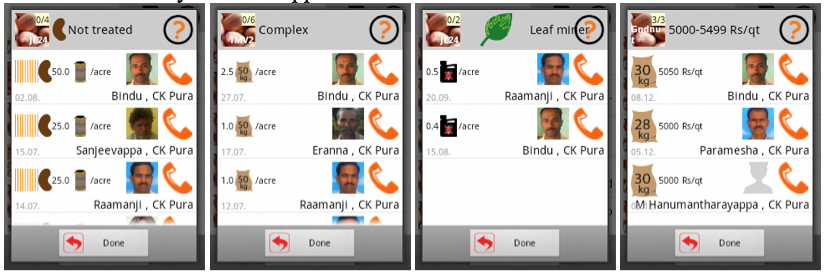
Figure 3: Example screens of views of other farmers’ activities for Details of other farmers’ actionsWhen reviewing the details of other farmers’ actions the application allowed calling the farmers directly from the application.
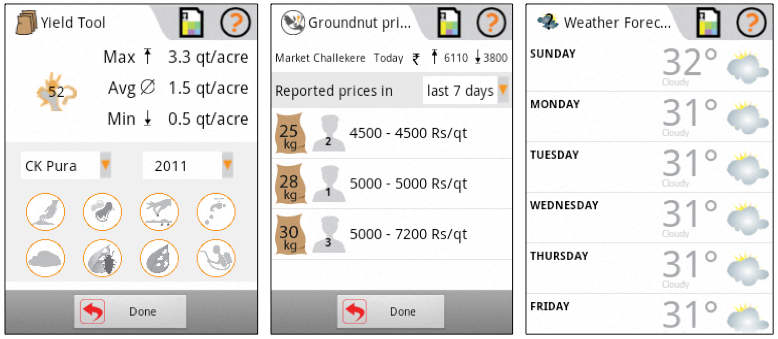
Figure 4: Example screens of details of other farmers’ activities for Yield Comparison ToolThe yield comparison tool (see Figure 15, left) allowed for comparing harvest yield data taken from 52 local farmers from the previous year regarding their conditions and actions taken. With this farmers could query the data and find out what the average, maximum and minimum yield was e.g. of the farmers who sowed the peanut variety TMV2. It allowed for answering questions such as “What would have happened if I had sown X?” The available data could be filtered by a) the soil type on which the crop was grown, b) the variety, c) the sowing window (each two week rain nakshatra was selectable) d) whether the crop had been irrigated or not e) whether the crop had been fertilized or not f) whether the crop had suffered from a pest or not g) whether the crop had suffered from a disease or not h) whether the crop had been sprayed or not The average, minimum and maximum yield of the people that fit the selected filters would be presented. Market PricesThe market prices part (see Figure 15, middle) included the official prices from the market in Challekere (the next aggregation point) taken from their website and also listed the priced that farmers had been paid for their different quality seeds (grouped by weight of the bags which in this case is synonymous with quality) by local traders. Weather forecastThe weather forecast (see Figure 15, right) provided the weather of the following seven days as forecast by the Indian Meteorological Department (taken from www.imd.gov.in). It included information about temperature, skies and expected precipitation in millimeters for the district.
Figure 5: Yield comparison (left) tool, market prices (middle), weather forecast (right)
|
Share |