
- français
- English
Prototype II
To quantify the fluorescence of a sample, it is enough to excite it with the specific absorption wavelength in a dark room, filter the light emitted by the excited sample and then quantify it.
The idea, as shown in the figure 1, is to use a LED generating light around 488 [nm] which is the eGFP absorption wavelength. The excited eGFP then emits light around 509 [nm]. To assure that the only light which is then quantified is the eGFP one, a filter which stops the 488 [nm] wavelength but let the 509 [nm] wavelength pass is inserted between the sample and the light quantifier.

Figure 1. The device works with an excitatory LED which light at 488[nm] excits the sample's eGFP, which light is filtered and quantified with the photoresistance.
A lens could be necessary if the light is not enough intense to be quantified by the light quantifier. It only serves to concentrate the light in one point and so on the light quantifier device.
Another way to do it is to use two filters. One for the light filtration and another dichroic filter. As shown in figure 2, the dichroic is able to reflects certain wavelength and let pass others. So the idea is to reflects at 45° the excitation wavelength and then let the emitted light pass, filter a second time and then quantify the light.

Figure 2. A dichroic filter is used to reflects the excitation light but it let the eGFP light pass through in order to filtrate the quantified light a second time.
The light quantifier could be a simple photo-resistance as shown in the figure 3. The system we used was very simple: a photo-resistance was used as the R1 place of a voltage divider so that we can measure the voltage Vout through the arduino's microcontroller’s analogic pin. The photo-resistance, as its name indicates, is a simple electric resistance which resistance change proportionally to the light it receives. More the light increases, more the resistance decreases and more Vout tends to equal Vin. Inversely, more the light decreases, more the resistance increases and more Vout tends to be null.


http://en.wikipedia.org/wiki/Voltage_divider
Figure 3. Represents the voltage divider connections and the calculation of Vout.
Another light quantifier which could be used is a light to frequency device, as the TSL235, which convert the light intensity it receives into a rectangular signal. The frequency at which the signal change is proportional to the light it receives. The arduino microcontroller can then tell us the frequency which can directly be used as the arbitrary unit value for the light's intensity measurements.
Calibration
The idea was then to make a first graphic of the measured light intensity in function of known concentrations, in order to calibrate the device. With this graphic it would be easy to find the curve's equation and implement it in the device calculation to find the corresponding arsenic concentration. Here an example: The figure 4 is the graphic with the known arsenic concentration :
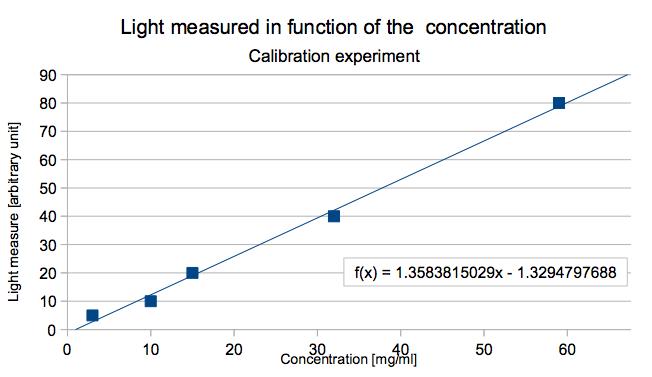
The curves equation is here :
light = slope * concentration + constant
for the example
light = 1.35 * concentration - 1.33
So when the concentration is isolated the equation gives the concentration in function of the light intensity:
concentration = ( light – constant ) / slope
for the example
concentration = ( light + 1.33 ) / 1.35
So the device could be able to give both the light intensity and the corresponding arsenic concentration based on this equation for all the further samples.
First essay
We first build a prototype with the photo-resistance. Figure 5 shows the cable connexions.

and the arduino code is shown here.
Second essay
But, the device prototype build like this wasn't able to differentiate samples with different arsenic concentration because the photo-resistance was not enough sensitive to detect the light emitted by the dextran samples whereas they emit more light than the transformed bacteria. So we tried to change the light sensor and use the light to frequency component TSL235.
All the device should then change because of both the code and the cable connexion wasn't the same for this component. Figure 6 shows the cable connexions.

And the code we used is available here.
We tested the device with different concentration of the fluorescent molecule dextran. The concentration was always diluted by two and the device always displayed a value which was the half of the previous value. So with the dextran's high fluorescence, we get the first results which confirm that this kind of device could work and which could distinguish different fluorescent intensities.
Unfortunately, as we went to Dr. Van der Meer's lab, the tests with the real bacteria grown in different arsenic concentrations, the device was completely unable to distinguish the different samples while the samples have been easily differentiated by the fluorometers of the laboratory. Whether the light emitted by the bacteria samples wasn't enough intense to be detected by the light to frequency meter, or its position was too far from the place where the sample was excited by the led, so that the eGFP protein in front of the light sensor weren't excited and thus haven't emitted enough light to be detected by it.
Another difficulty we met, was to find the different components which prices aren't accessible to everyone (a filter can easy be about 300 CHF or more).