
- français
- English
week-15-16:line score
Introduction
The goal is to reviste the scoring functions used by the algorithm.
We will, first, define some objects. Then, we will briefly remember where the lineScore function is use. Now, we have everything to start, we will look at different possibilities for score function and how to implement it. Then, we will see a way to compare the three most interesting functions. Finally, we will discuss a little bit of the code infrastructure needed for this line score evaluation.
Nomenclature
line: A string that go from one pin to another. (A line is implemented as list of pixel position.)
resultImage: The image that hold the result actual result of the algorithm. At begin this image is white, then at each step the new line is drawn.
diffImage: The diffImage is the virtual image produce by subtracting the actual resultImage from the original image. This image is virtual, because it can contains negatives values and we normally don't have negative value in grayscale images
sketchImage: The sketchImage is produce by subtracting the actual resultImage from the original image without going into the negatives values. So the minimal value is 0.
Context
The base algorithm evaluates at each step all the lines from the current pin to all other pins using a score function (We can view this as a cost function, but, here it seems more appropriate to use the term of score).
This score function takes as input a line and return the score of this line.
Functions
We have implement the following lineScore functions. You can find the pseudo code bellow. The names are the same as in the code but the implementation differs slightly. In particular, the diffImage doesn't "exist" as an object, but is computed inside the function.
The first function, lineScore, was developt using the algorithm used by Christian Siegel (https://github.com/christiansiegel/knitter). The other functions was completly developt by us.
Function: lineScore
Input: set of pixel P
Output: score obtains by this set of pixel
Algorithm:
For each pixel in P:
color = pixel.getColorFromTheSketchImage() // encoded as RGB
darkness = color.getDarkness() // 255 - average of RGB
score = score + darkness
counter = counter + 1
finalScore = score / counter
return finalScore
Idea behind this score function:
If we choose the darker line in the sketch image. This line will be added in result image and the difference between the original image and the result image will be smaller.
Function: lineScoreEquilibrate
Input: set of pixel P
Output: score obtains by this set of pixel
Algorithm:
For each pixel in P:
color = pixel.getColorFromTheSketchImage()
darkness = color.getDarkness() - 0.3 * color.limit() // color.limit() is the maximal darkness value
score = score + darkness
counter = counter + 1
finalScore = score / counter
return finalScore
Idea behind this score function and remarks:
The idea was to penalize the line that go thoough white pixels. So, we shifft, all the range of possible darkness values. But, logically, we obtain the same result. We, just, shiffted the score.
Function: lineScoreSignedDifferenceBetweenOriginalAndResult
Input: set of pixel P
Output: score obtains by this set of pixel
Algorithm:
For each pixel in P:
color = pixel.getColorFromDiffImage() // we change the input image!
darkness = color.getDarkness() // The darkness is virtual and can be neagtif
score = score + darkness
counter = counter + 1
finalScore = score / counter
return finalScore
Idea behind this score function and remarks:
The idea was to penalize, also, the pixel that get darker than the orignal image.
Function: lineScoreWeightedExtremity
Input: set of pixel P
Output: score obtains by this set of pixel
Algorithm:
maxFactor = 3
For each pixel in P:
color = pixel.getColorFromTheDiffImage()
darkness = color.getDarkness() // the value is between -255 and 255
factor = 1/color.limit() * absoluteValue(darkness) // the value is between 0 and 1
factor = power(maxFactor, factor) // this create an explonential function from 1 to maxFactor
scrore = score + factor * darkness
counter = counter + 1
finalScore = score / counter
return finalScore
Idea behind this score function and remarks :
The idea was to penelize or favorize more the value that are far of the original value.
Function: lineScoreDelta
Input: list of pixel L // assume with an order
Output: score obtains by this set of pixel
Algorithm:
For each pixel in list L\{last} : // We just don't take the last pixel of the list because, it hasn't a next pixel
nextPixel = pixel.getNext()
darkness1 = pixel.getDarkness()
darkness2 = nextPixel.getDarkness()
diff = absoluteValue(darkness1 - darkness2)
score = score + diff
counter = counter + 1
finalScore = score / counter
return finalScore
Idea behind this score function and remarks :
The human eyes are more aware of contrast than lightness. The idea was to use this fact and search for the line with the less contrast. But use alone, always the same lines are chossen.
Metrics
We have use two metrics to evaluate the different score functions. The first one is the absolute error of the image. The second one is human preference.
Absolute error: This metric is simply the sum of the absolute difference of darkness between the resultImage and the originalImage.
Human preference: I ask to six persons to choose for each image (abstract, city, .....) the version they prefer. The pictures used for this test are in the section "Best Score Images".
We like they idea to have two really different metrics. On one hand, absolute value error (AE) give us a really easy and fair way to evaluate the result. This can be interpreted as the distance of the result image from the original image. We may, also, use a mean square error (MSE) or an error function based on neighbor contrast, but we don't go in this direction for time reason. On the other hand, people preferences gives us a subjective metrics but, finally, the images will be viewed by human being.
Data used for evaluation
We have run the algorithm with the following three lineScore functions; lineScore, lineScoreSignedDifferenceBetweenOriginalAndResult, lineScoreWeightedExtremity.
We do not evaluate lineScoreEquilibrate because it produce exactly the same result as lineScore and we do not evaluate lineScoreDelta because it need to be combine to not loop always over the same lines.
We use these tree lineScore functions on 7 images, form 0 to 30002 strings. We use a square randomize grid (but always the same!) to not have the effluence of the border and to not have the Moiré effect.
For each of the images and for each of the functions at each 1000 strings, we save an image and compute the absolute error.
Representation of data
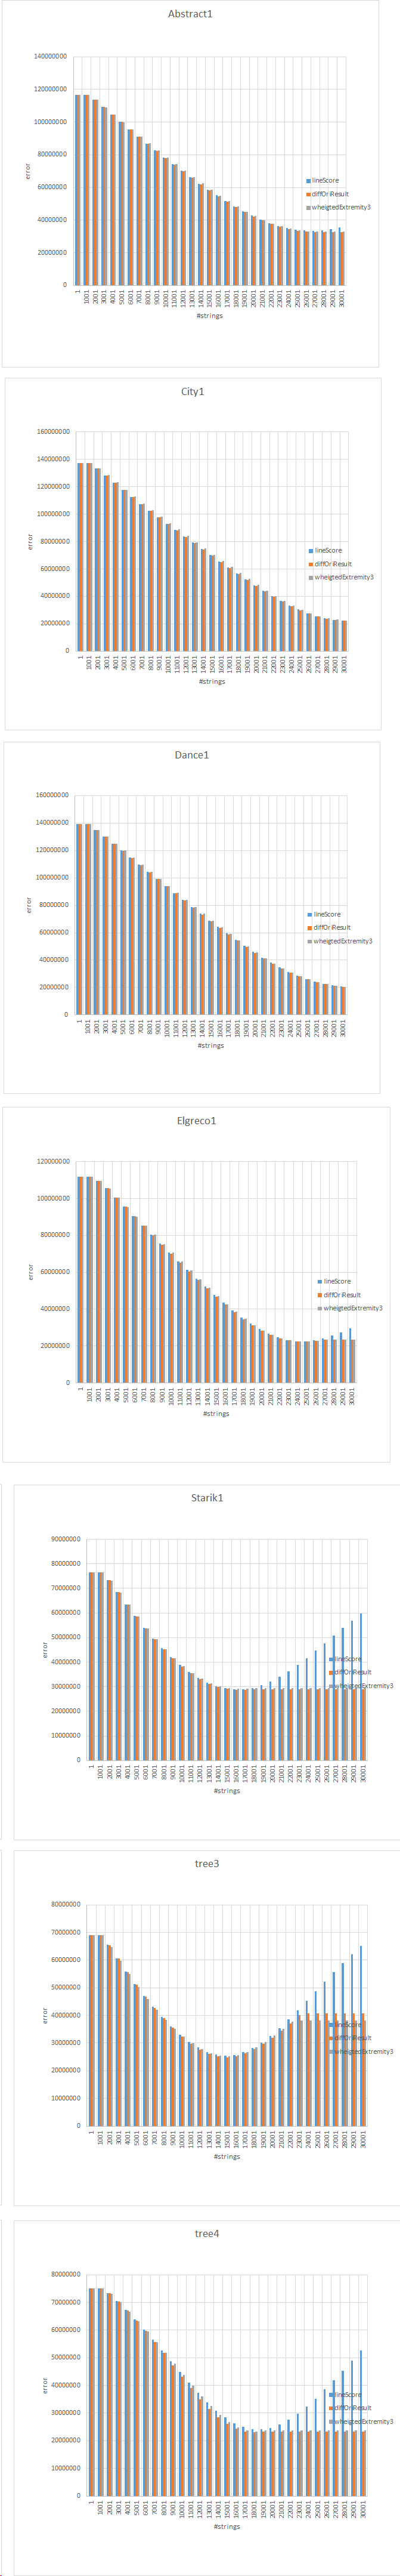
To let the data be more representative. We produce charts and gif. The charts are based on absolute error for each image. We also want to view the differences of the two main categories of lineScore functions during the process. So, we produce gif that shows at each 1000 string the difference between the LineScore and the DiffOriResult function.
We put all of them at the end of this pages.
Analysis
Comparison between DiffOriRsult (D) and weightedExtremity3 (W)
First, we like to highlight the fact that D and W function are really close in the resulting images and in the underline scoring procedure. In fact, W is a try to tune the D function. We, just, give more weight to the extreme values.
Human preference for W or D is not clear (see table in section “Human preverence”). The curve of the charts have the same shape (see charts in section “Charts of absolute error by images”). Differentiation images are quite homogenous (sees images in section “Difference between scoring function at the minimal absolut value point”). So, we can state that W and D belong to the same category of scoring function and the comparison between these two scoring functions are not so relevant. Thus, for the rest of the analysis, we will focus on the comparison between lineScore and diffOriResult function.
Comparison between LineScore (L) and DiffOriRsult (D)
We see from the charts that process using D function are stabilize earlier than process using L function. This come from the fact, that all lines in D become bad earlier and the process starts to loop in a deterministic fashion. At opposite, L tries still to ameliorate the picture until the sketchImage is totally white.
Besides, the human strongly prefer function W and D over L. The W and D function together get 38 votes ant the function L only 4 votes. The absolute error difference between functions D and L, at the minimal point, is less than 1 percent in every cases. This mean that globally the error is quite the same. If we take a look at an absolute error difference around 1 percent between two images using the same scoring function, we, just, observe than on is slightly lighter than the other. (See the images of section "One percent difference"). But, in the case of an absolute error difference of 1 percent between two images using other scoring function, the image seems more contrasted, more precise and clearly preferred by human. If we make the differentiation of the two images, we observe that the differences are concentrate around white areas (see images of sections "Difference between linescore and diffOriResult at the minimal absolute value point"). This seems logical, because one D function cares about white areas and L function are more focused on respecting the black areas. Y
Finally, we can claim that our DiffOriResult function clearly improve the existing algorithm.
Implemetation needed for lineScore evaluation:
- A grid memorization system
We want to use a randomify grid, but always the same to not influence the result. So we came up, with a way to save a pins position and to load them for a other image.
(commit:6fafa473e2c97ecd76a8bf22705cbfdcc205dcbc) - A script system integrated to the soft knit
We do not want to launch knitSoft 18 times or much more to produce the data. So, we build a way to write code in a file a start it from the interface
(launch background script button)
(commit:6680489fcf70376087e4aa930025998687738aec) - bash script to produce gif from images
(commit:a20b3e4c4f2842c423e3ade14268a81e1c0244b9) - bash script to extract data from filenamce
(commit:e98136319d733cf5aff785dd7aac322fba89e9c0)
Best Score Images: (Used for human test)
Images with the smallest absolut error for each series.
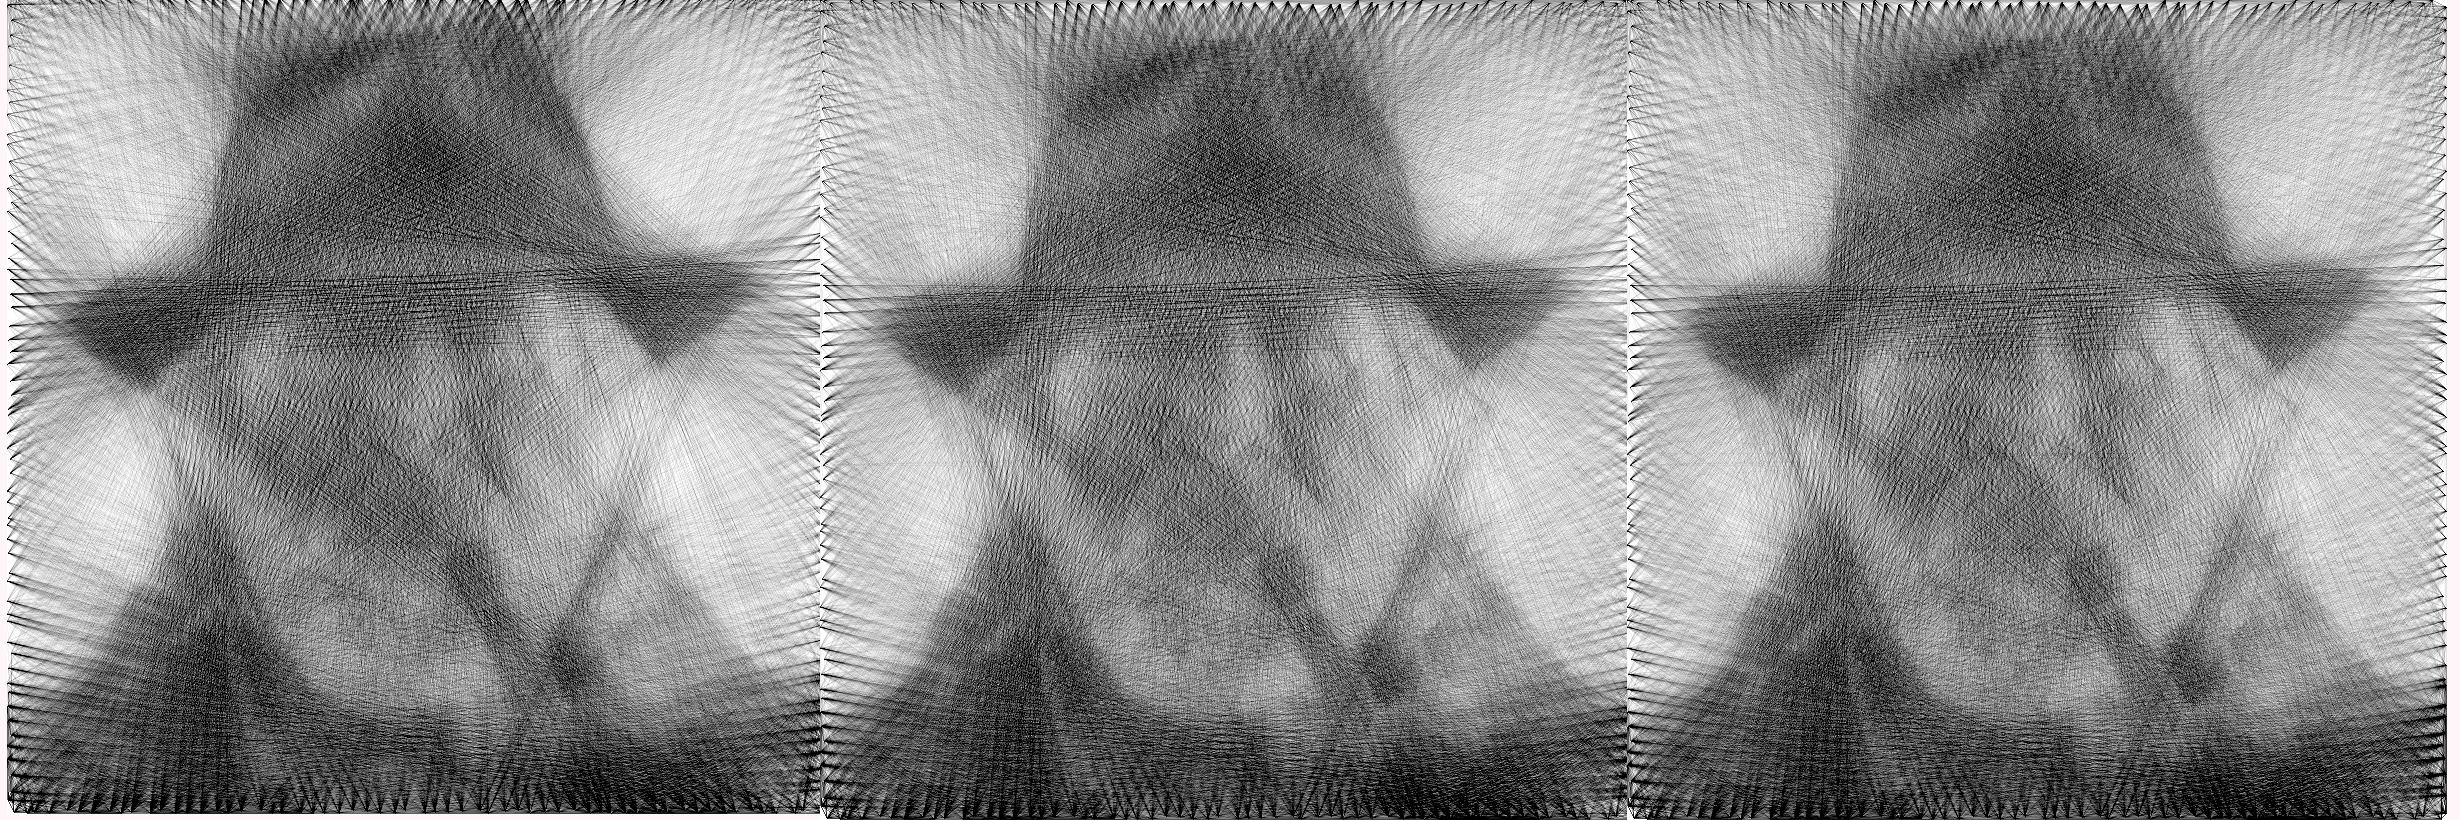
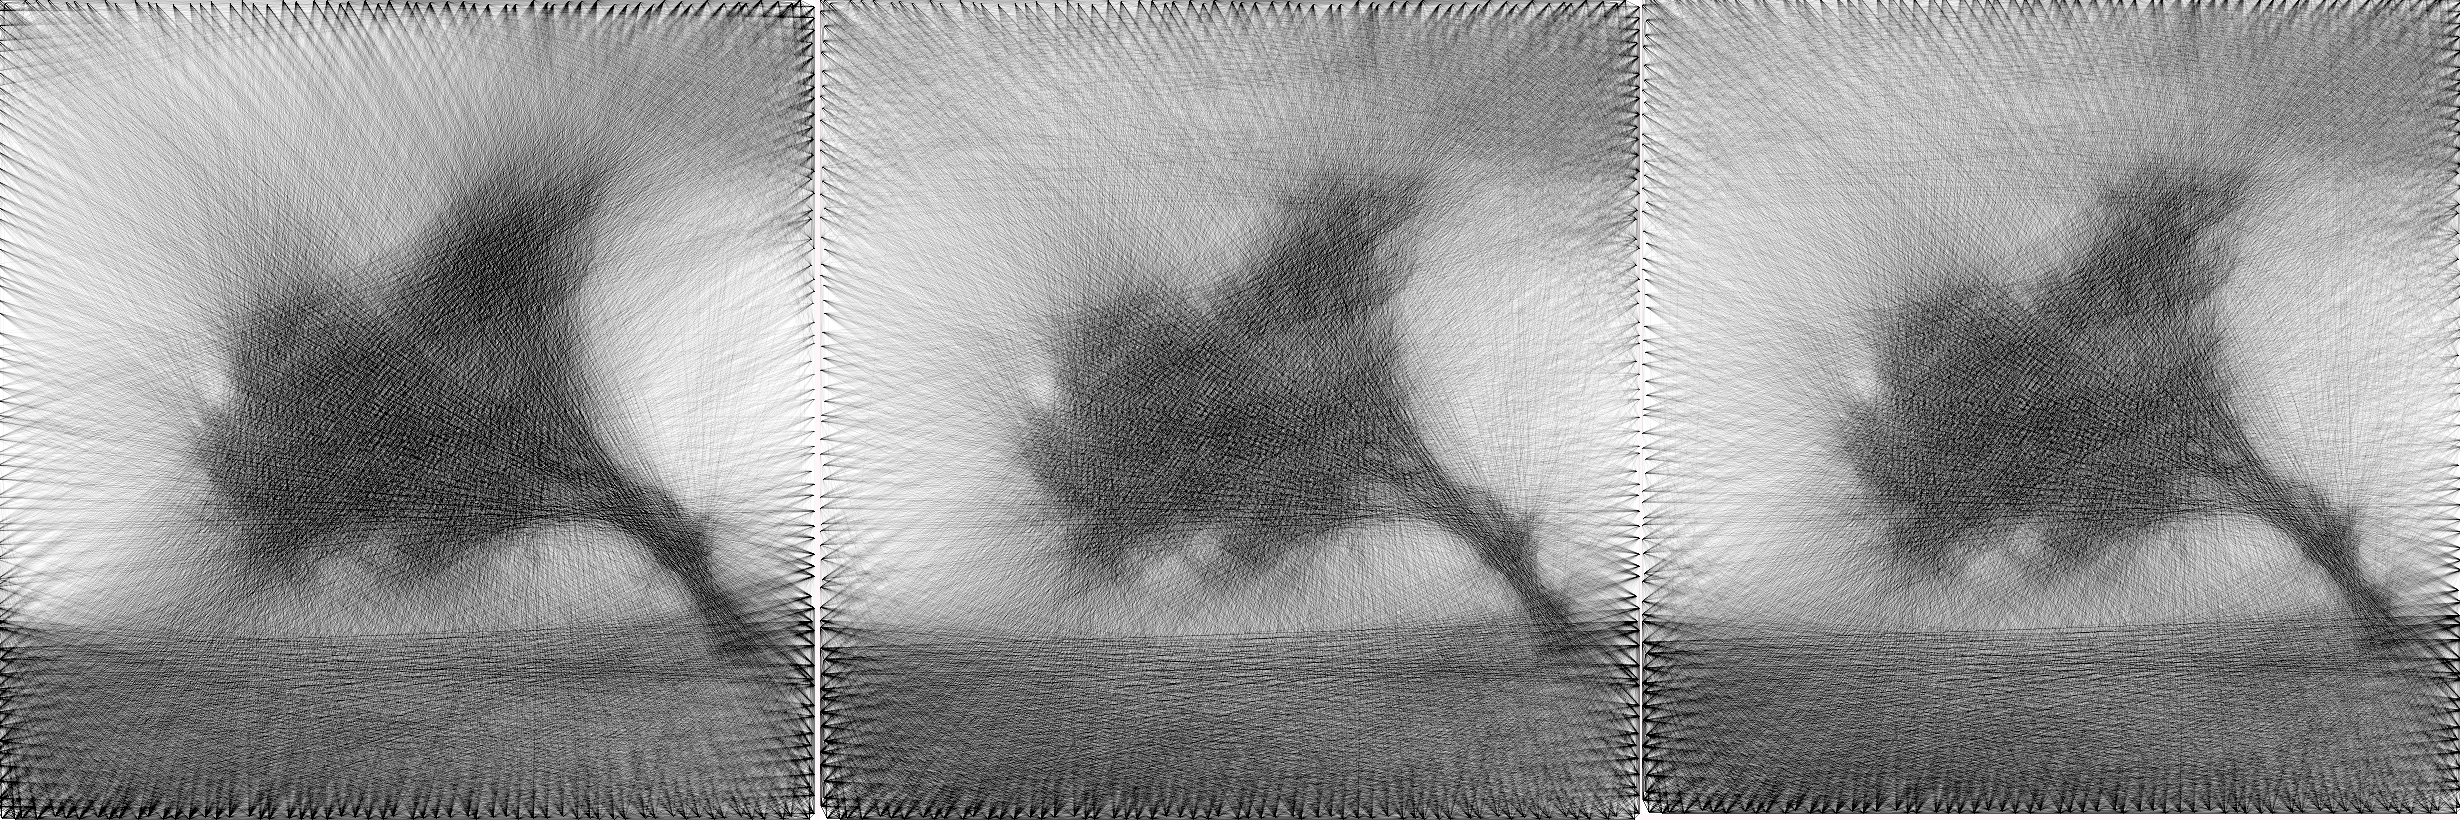
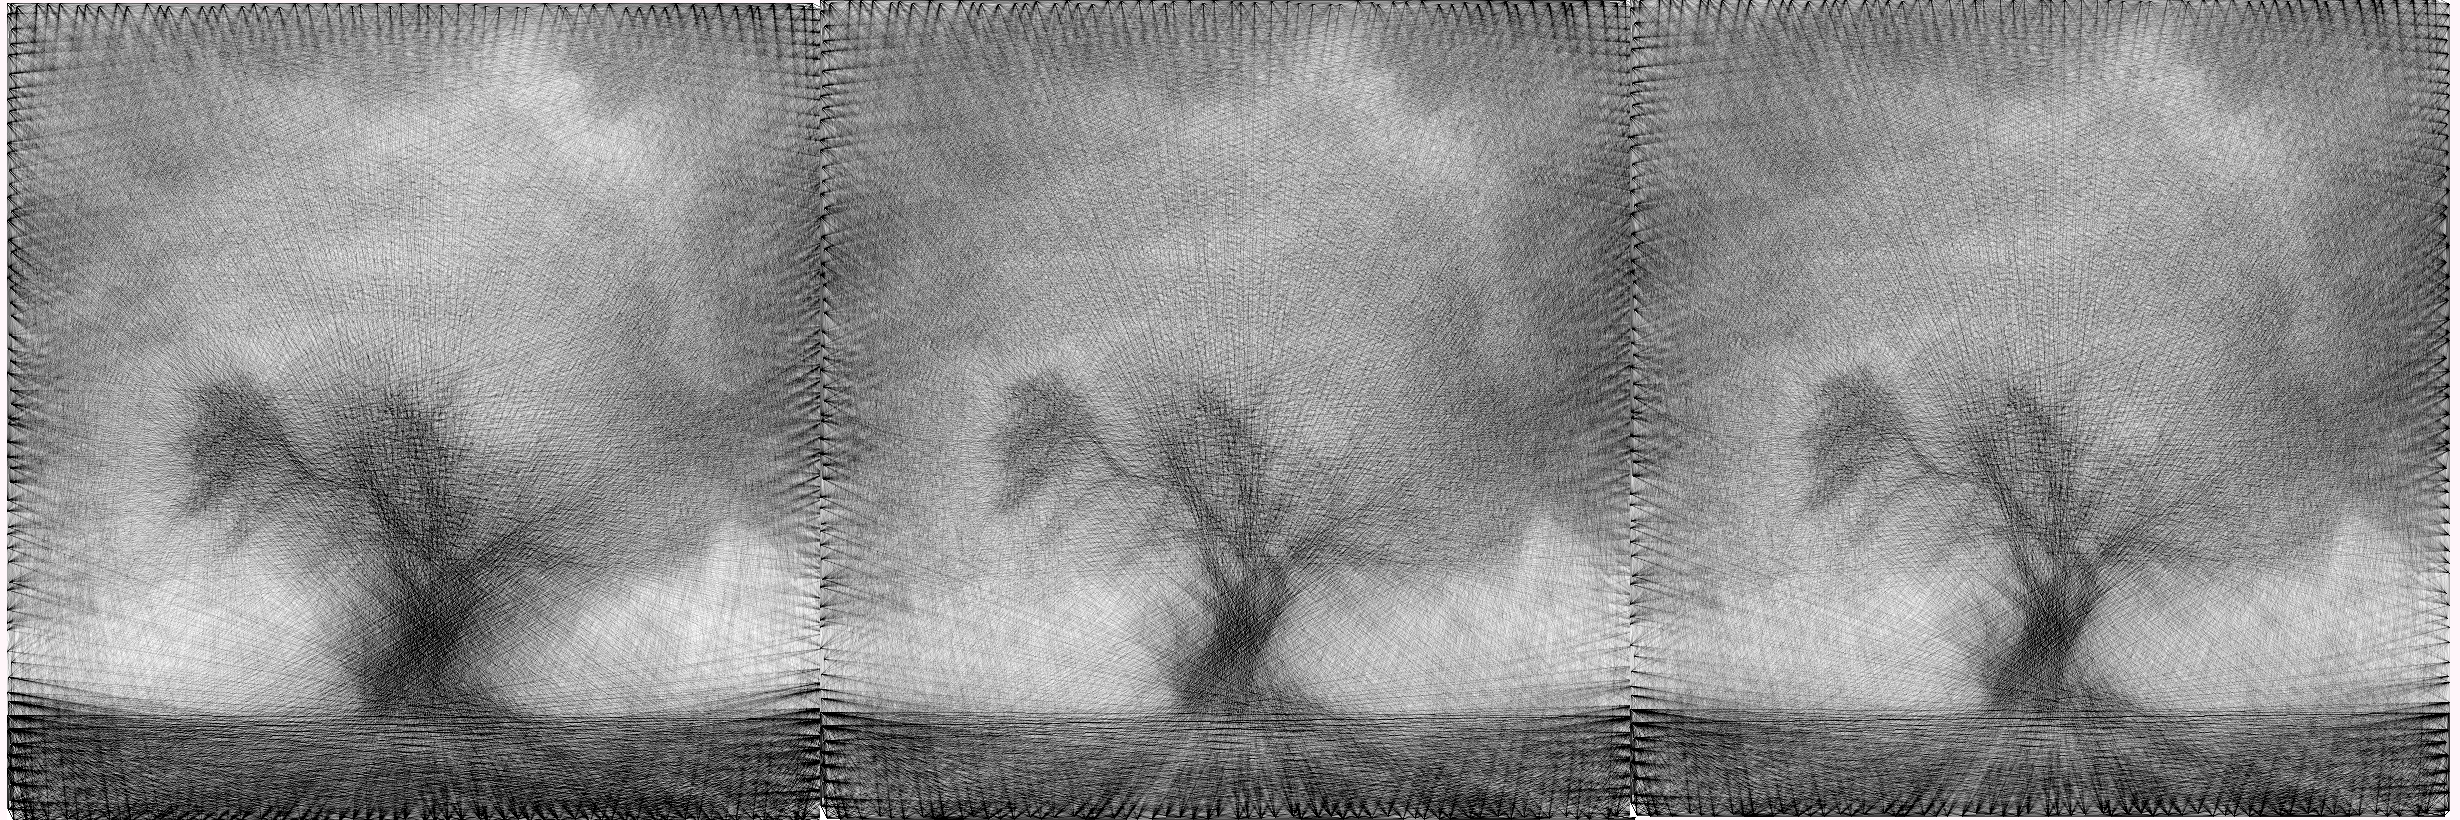
Left: LineScore middle: DiffOriResult Right: WheigtedExtremity
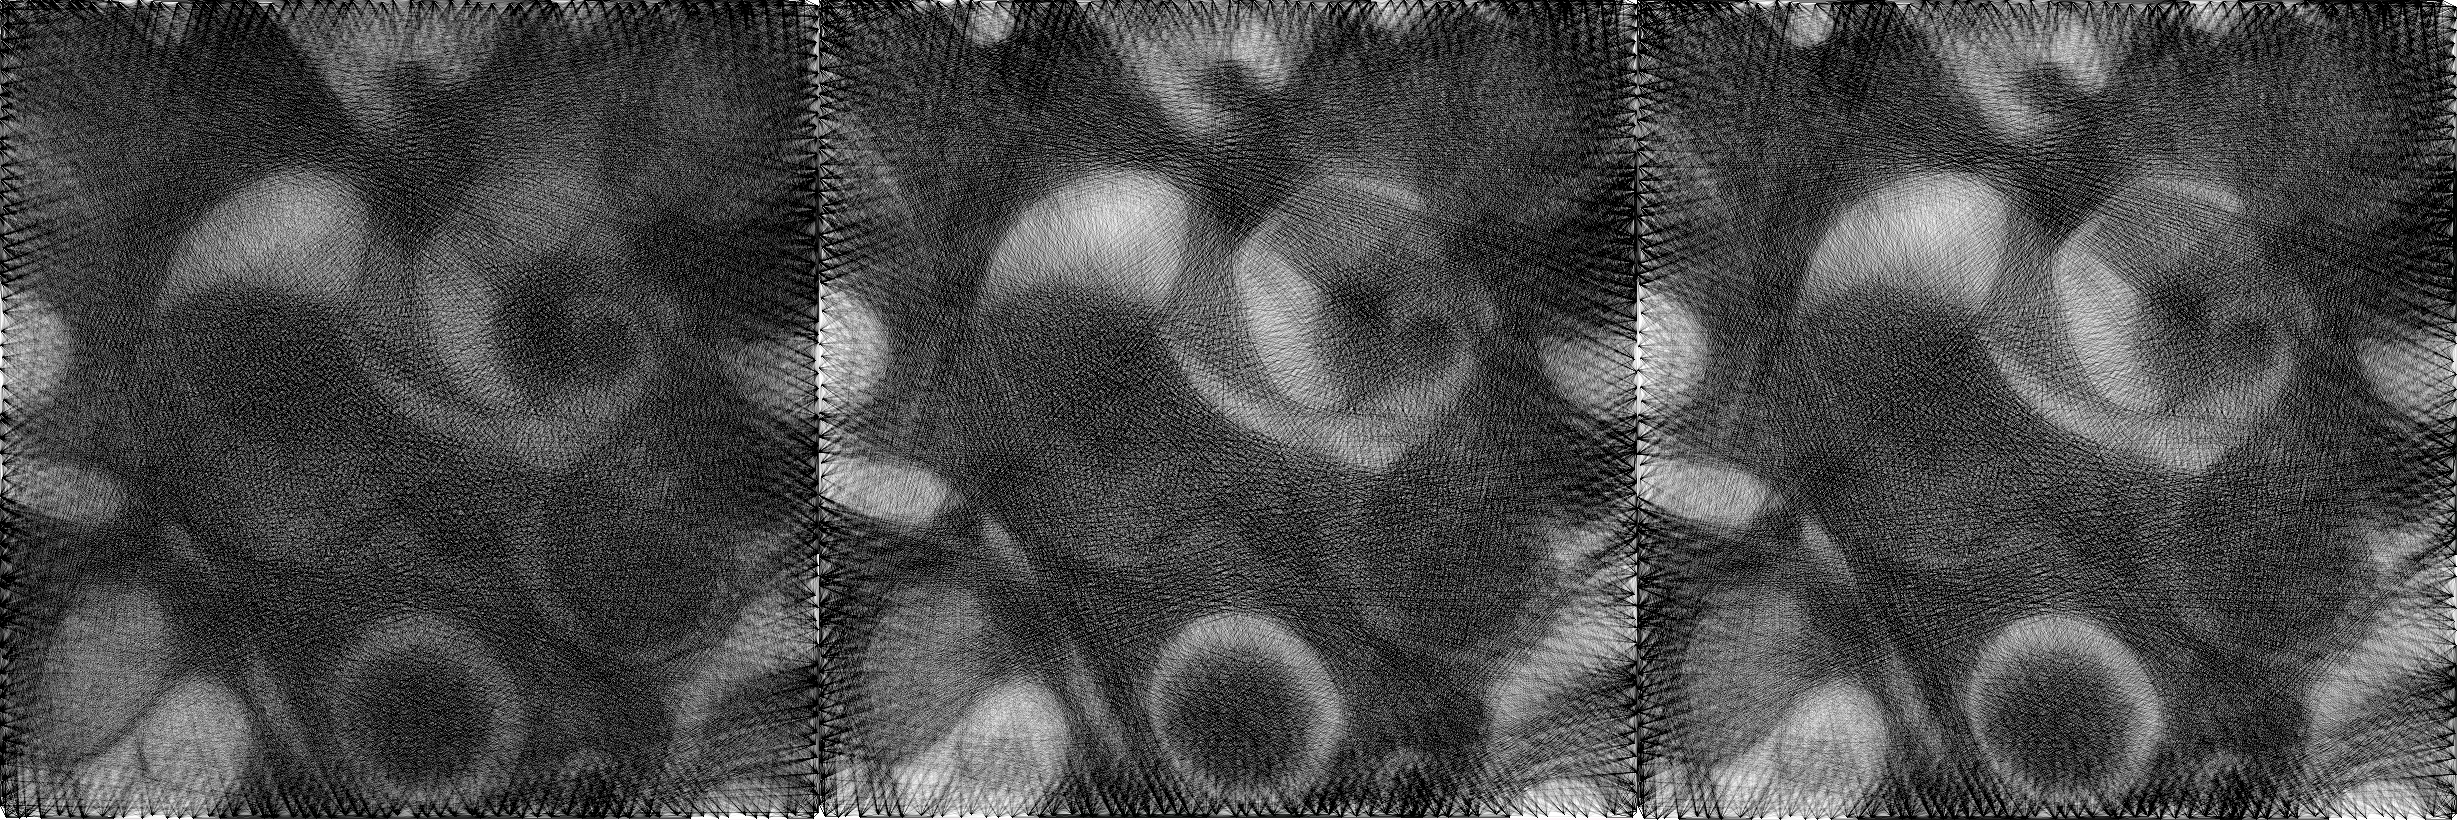
Abstract1, 27000 strings
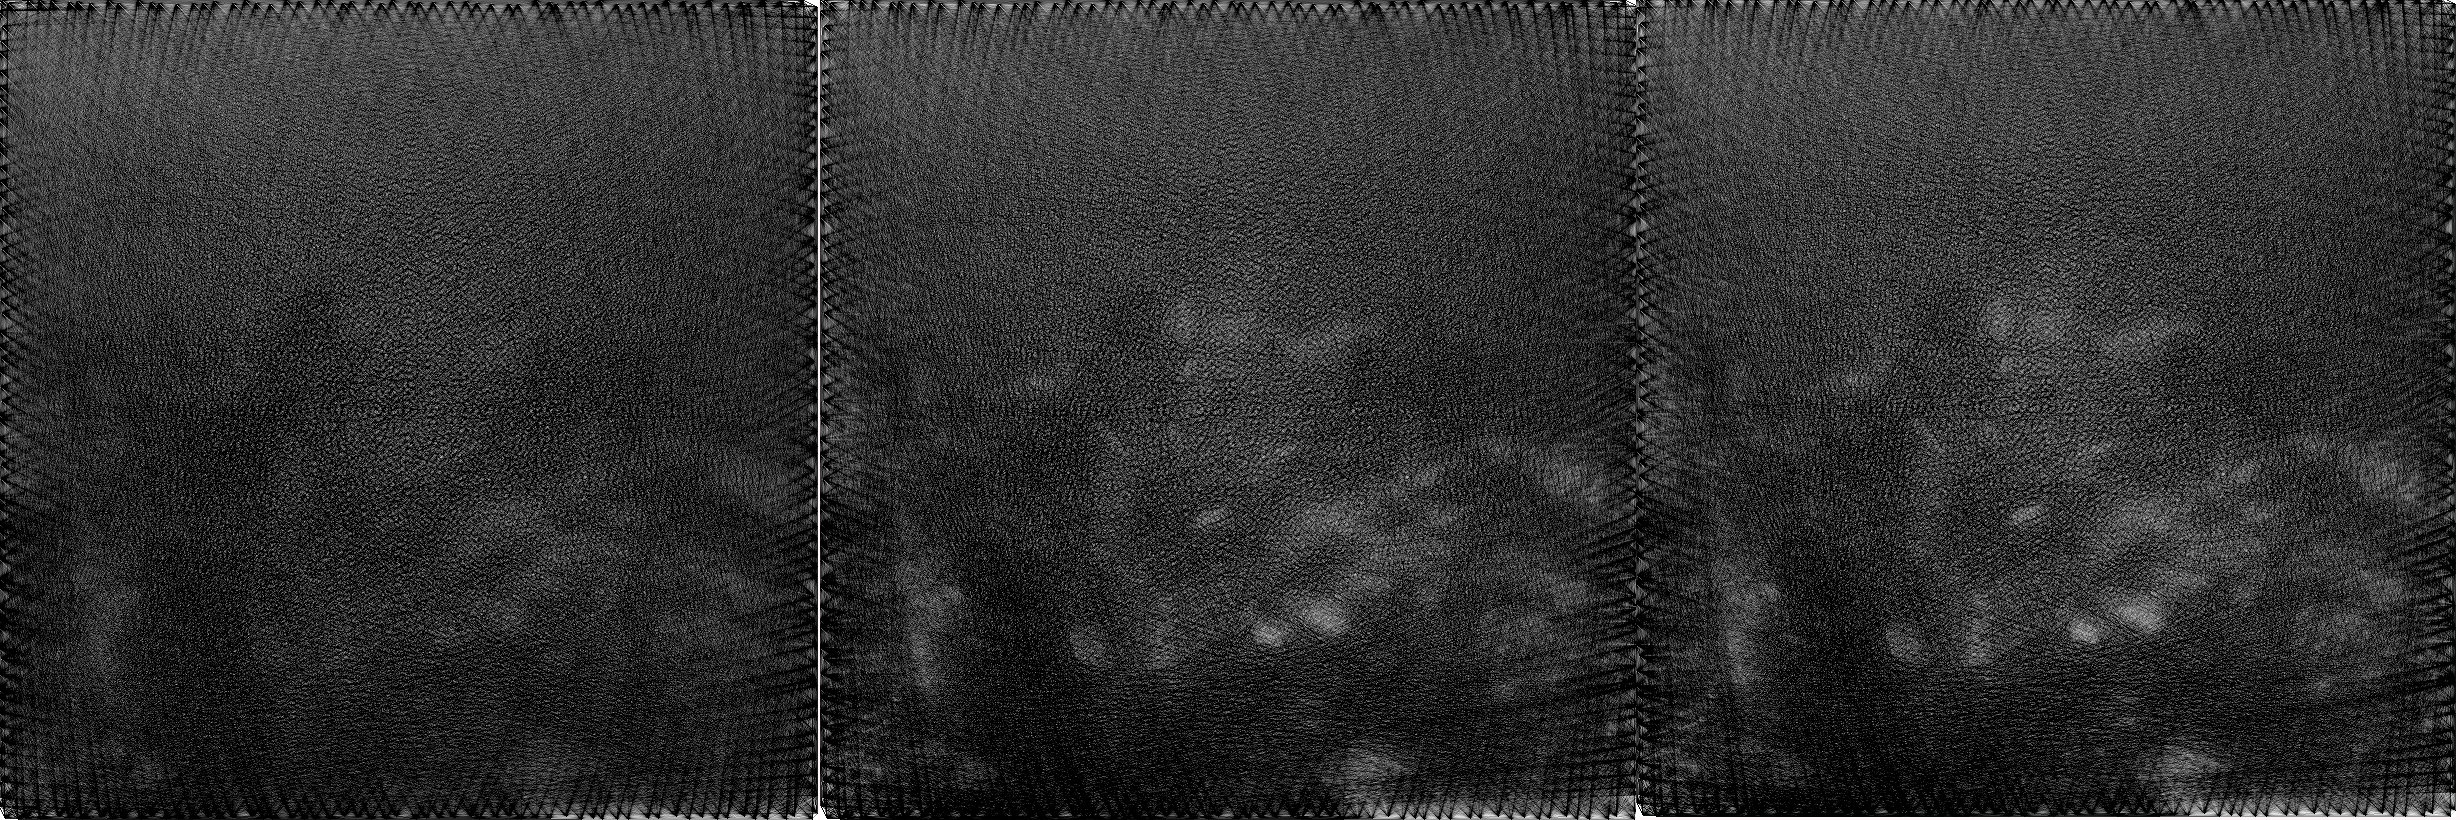
City1, 30000 strings
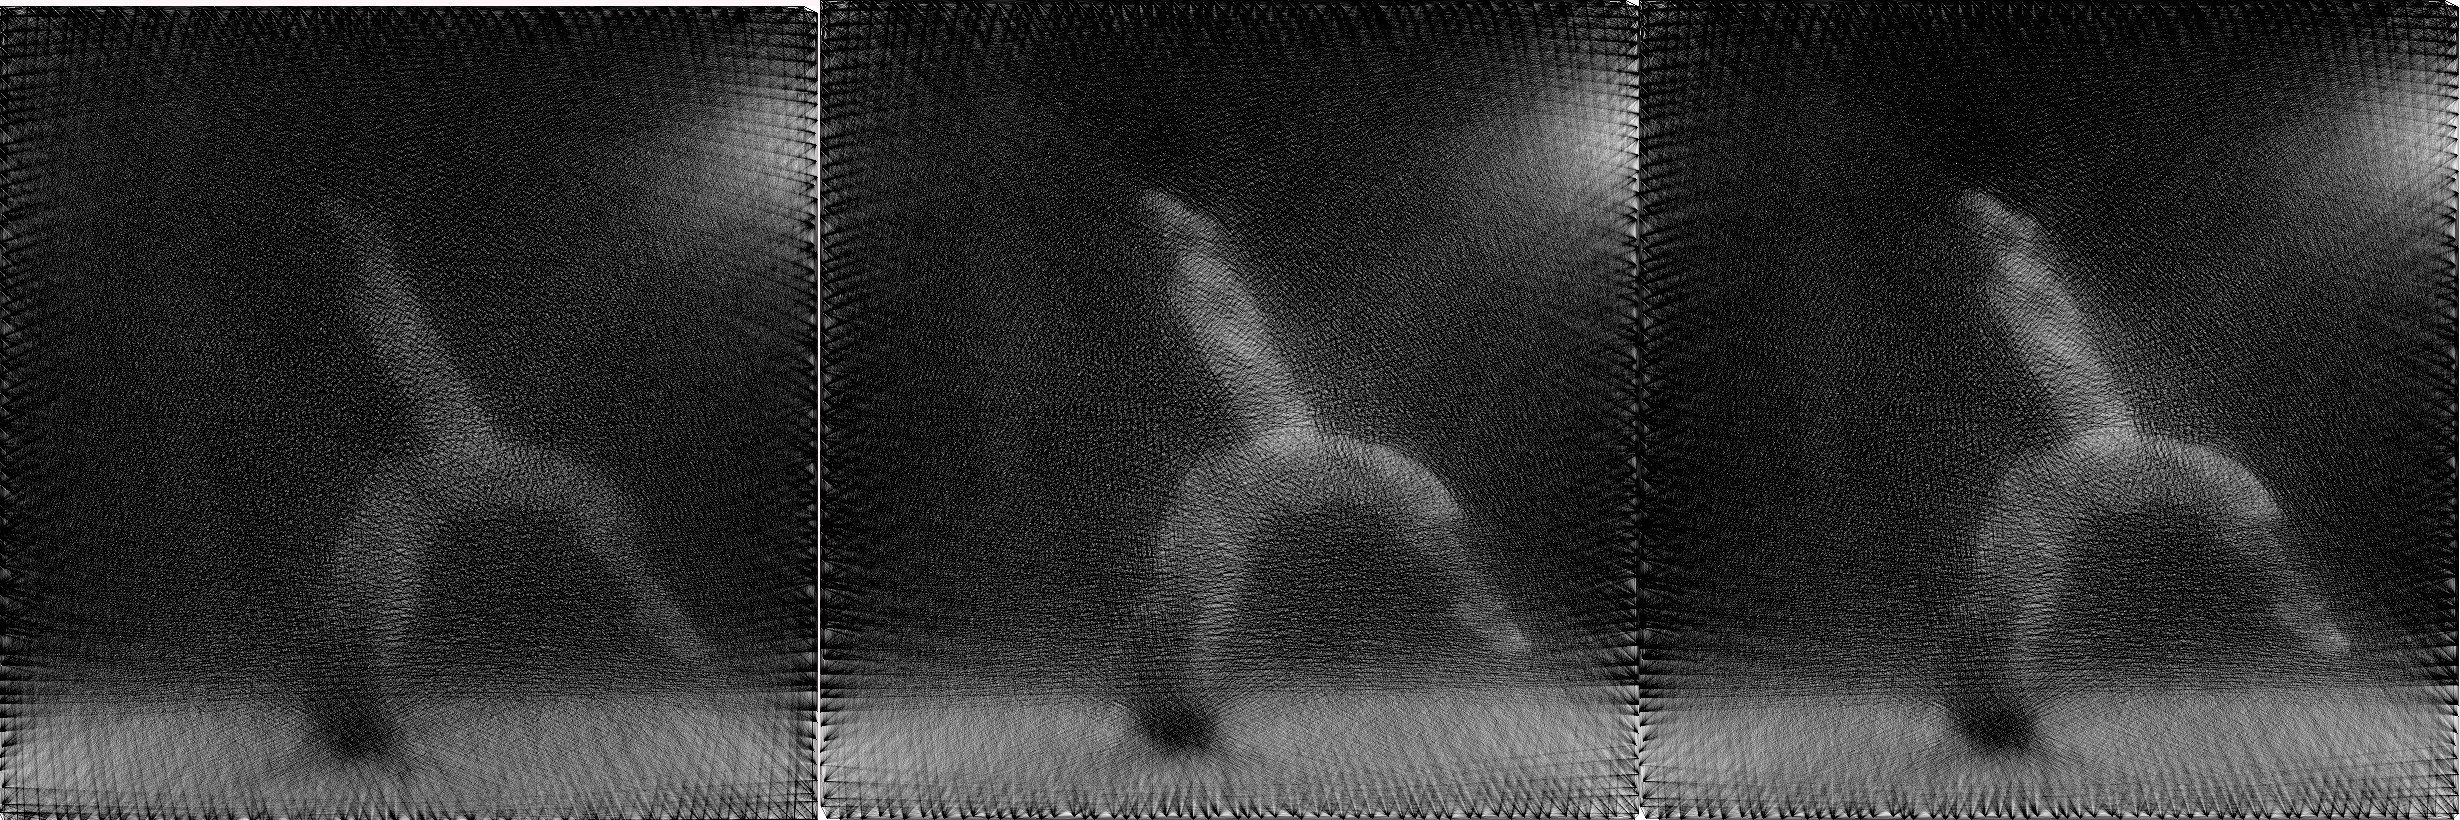
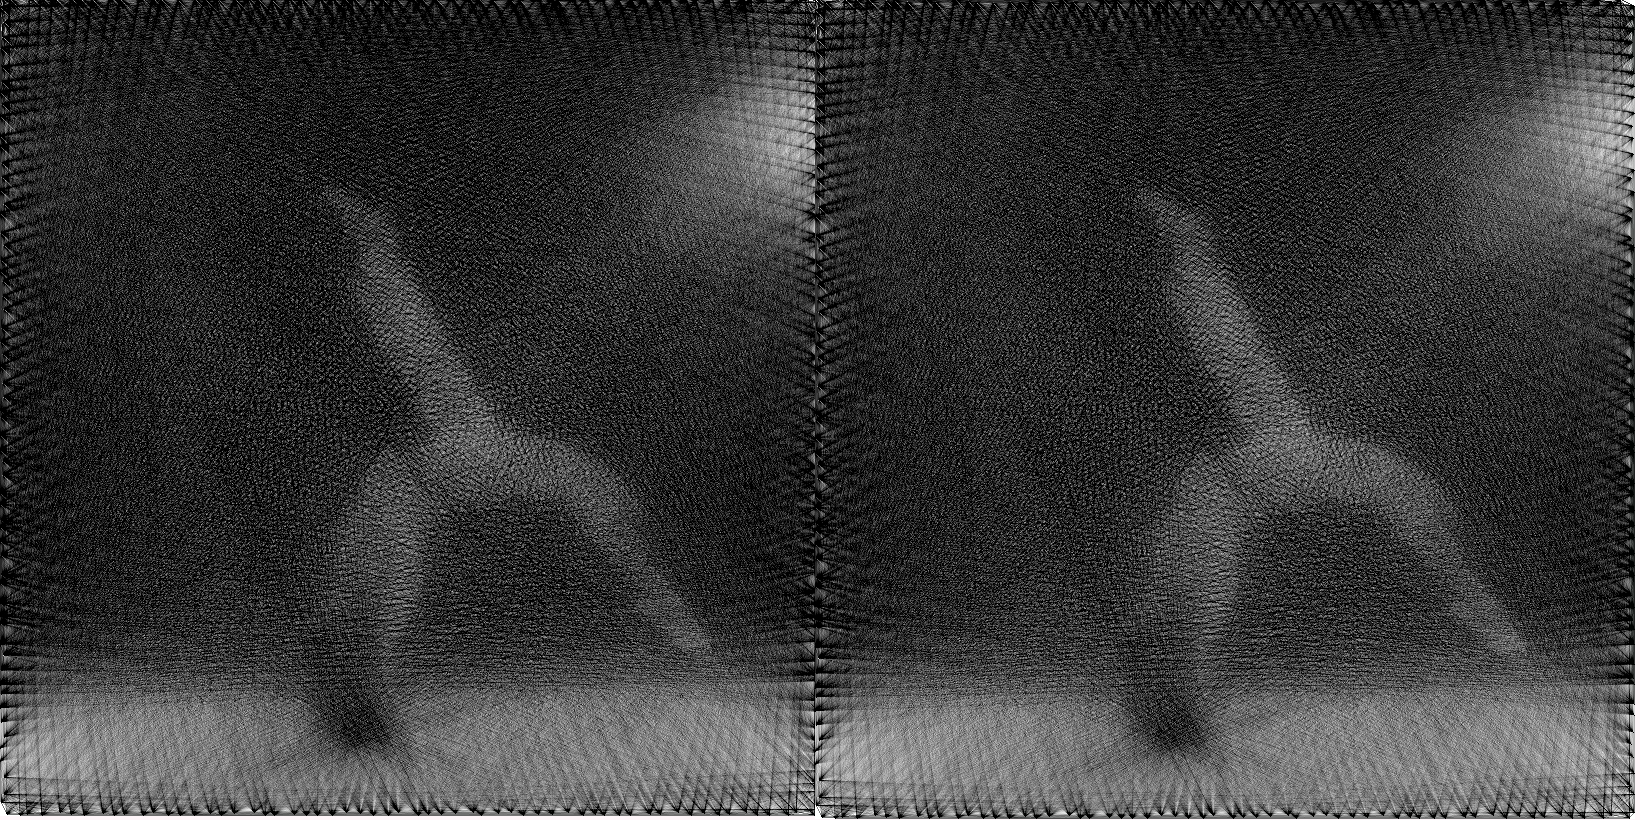
dance1, 30000 strings
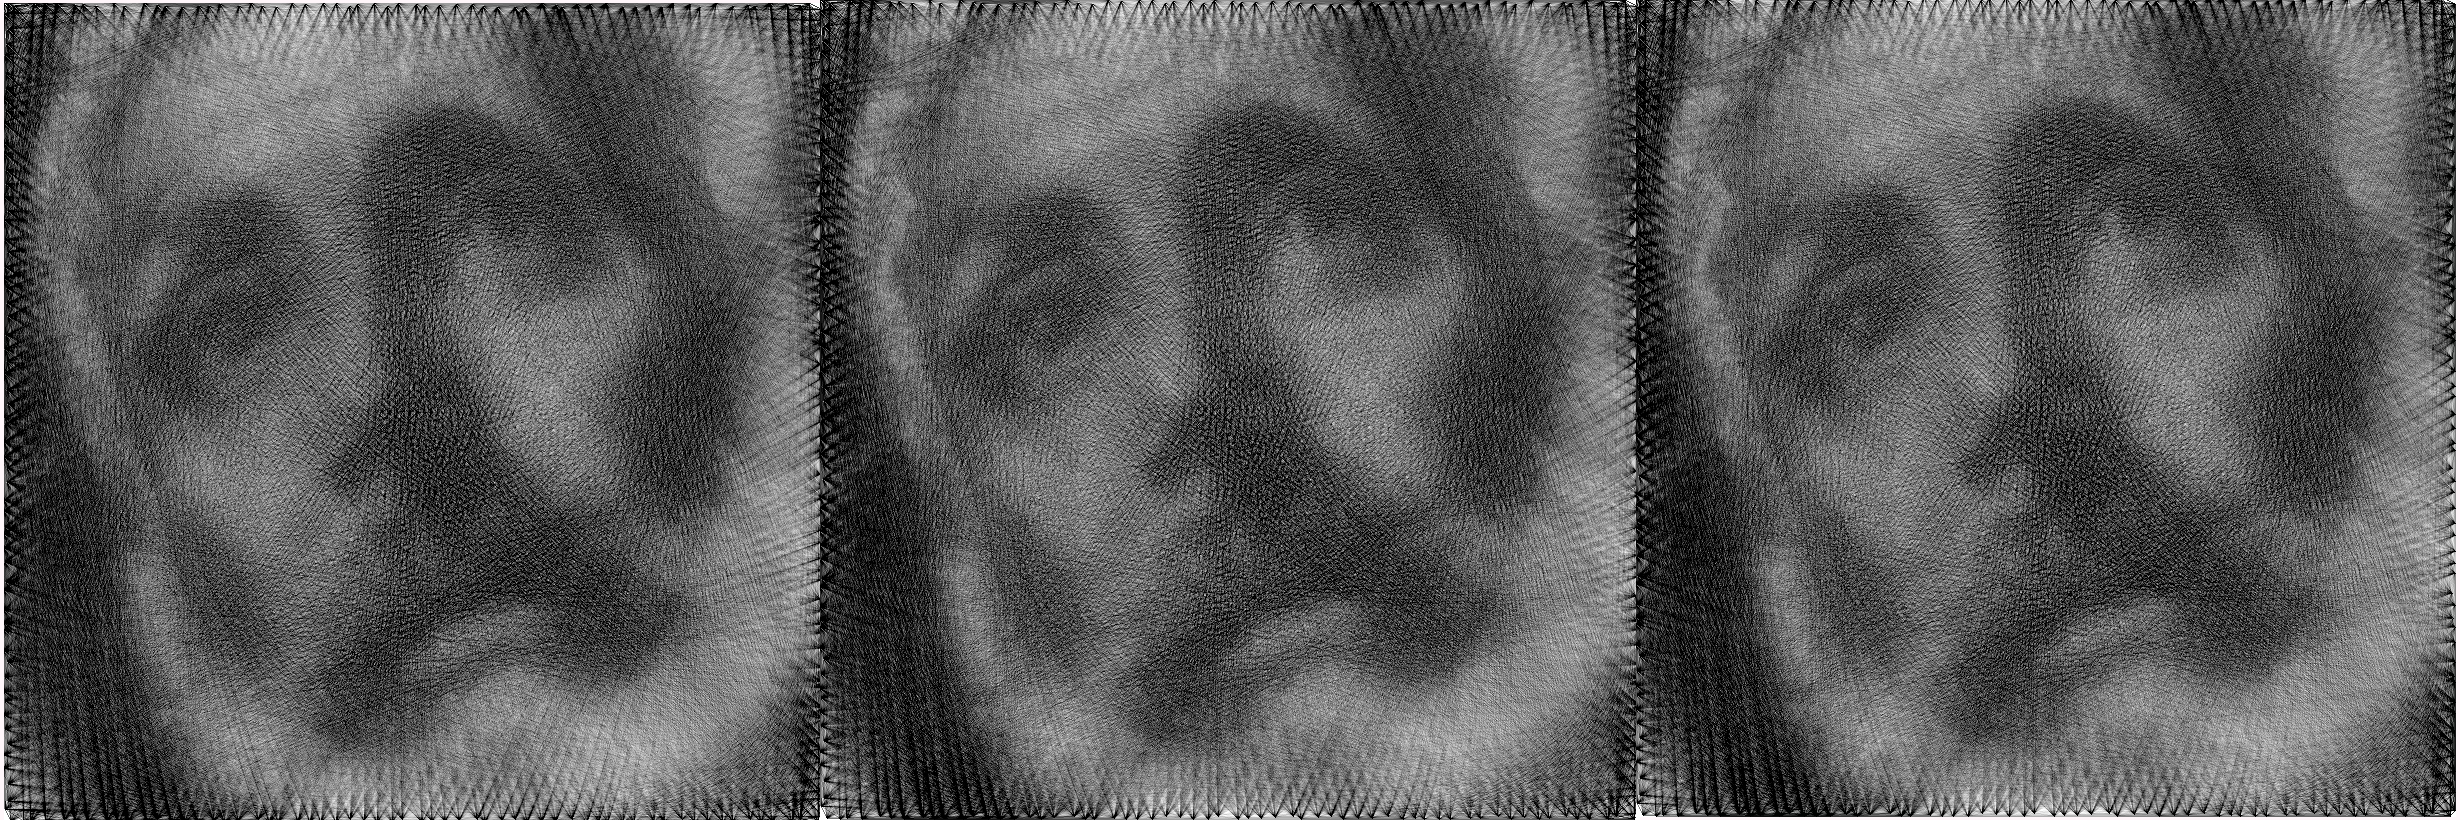
Elgerco1, 25000 strings
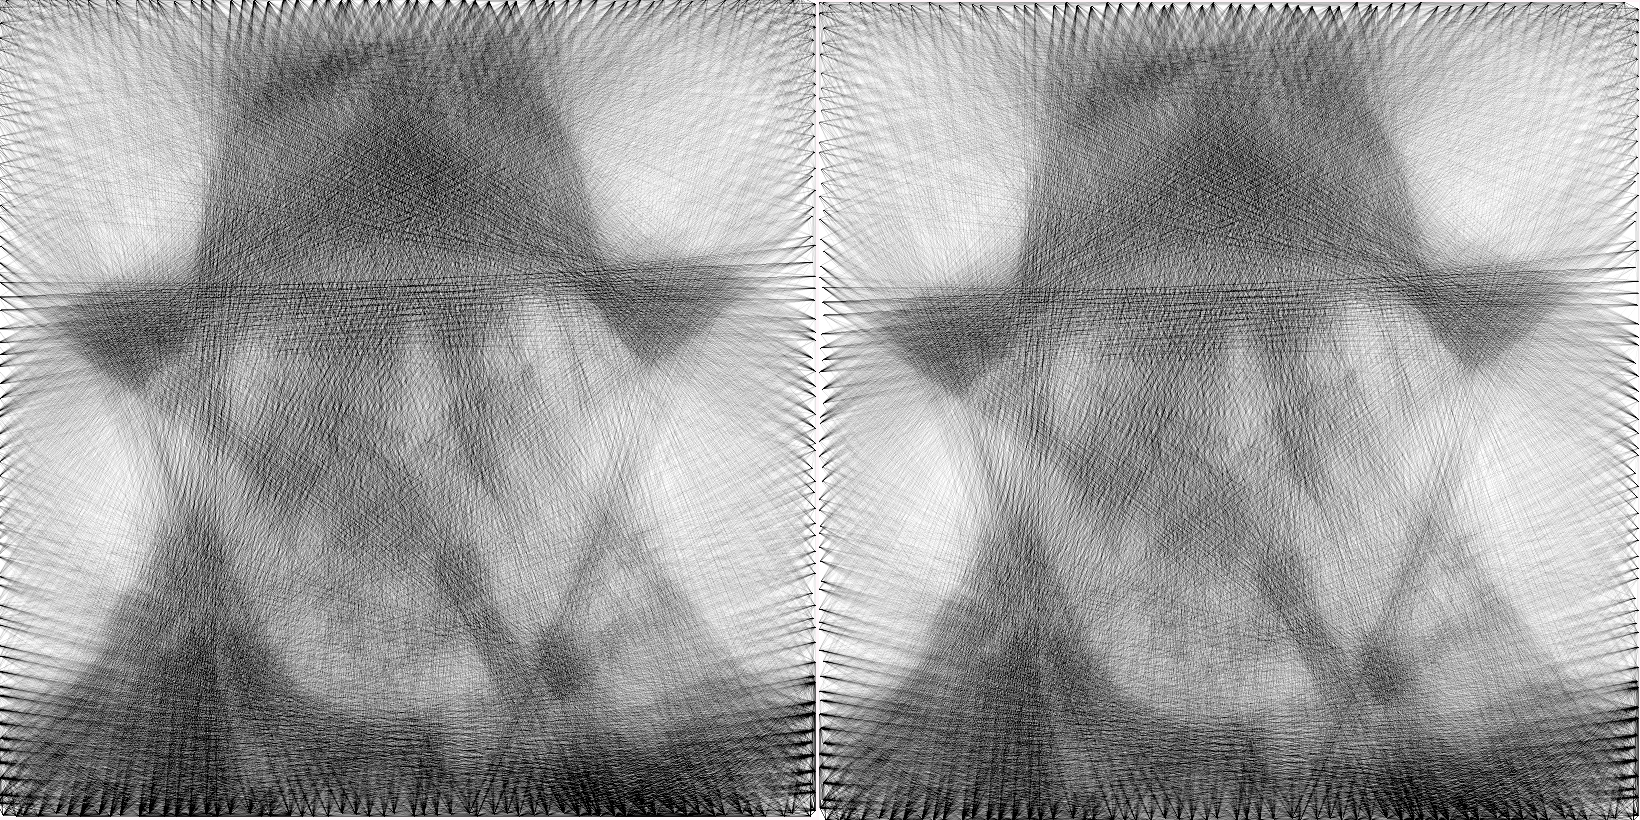
Starik1, 16 strings
Tree3, 15 strings
Tree4, 19 strings
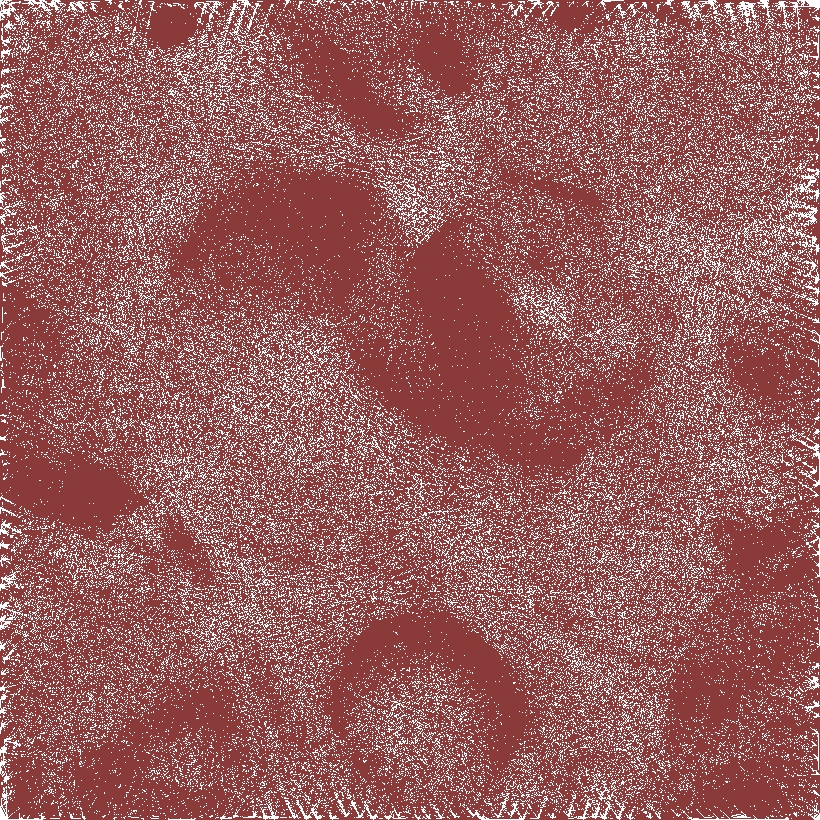
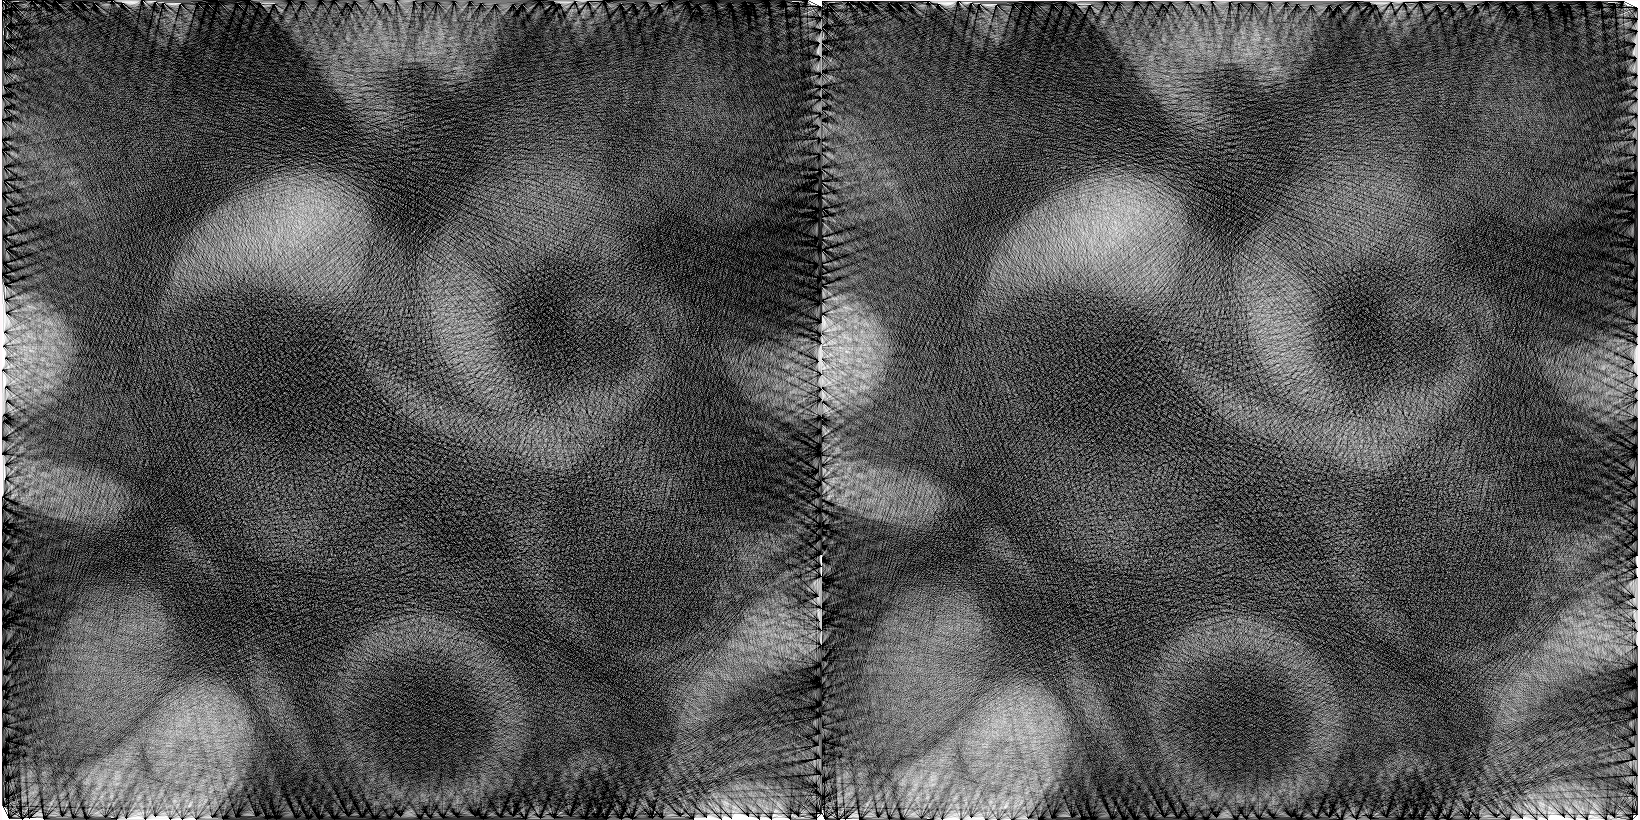
Difference between scoring function at the minimal absolut value point:
The following images are the absolut error between lineScore and diffOriResult (left images) or between diffOriResult and wheigtedExtremity3 (right images) and at the minimal absoulte error point. They was compute using compare of imagemagik. More precisly, they was compute using the following command line:
>>> compare "$file1" "$file2" -metric mae -fuzz 1% -compose src -quality 100 -highlight-color IndianRed4 -lowlight-color White $outname
where $file1 = linescore image , $file2 = diffOriResult image for left image
where $line1 = diffOriResult image, $file2 = wheigtedExtremity3 for right image
abstract1, 2700 strings
City1, 30000 strings
dance1, 30000 strings
elgreco1, 25000
starik1, 16000 strings
tree3, 15000 strings
tree4, 19000 strings
Human preferences results:
| IMAGE | abstract | city | dance | elgreco | starik | tree3 | tree4 |
|---|---|---|---|---|---|---|---|
| Person1 | W | D | D | W | D | D | L |
| Person2 | D | D | W | D | W | L | D |
| Person3 | W | D | W | W | W | D | W |
| Person4 | D | W | D | W | L | L | D |
| Person5 | W | W | W | D | W | D | W |
| Person6 | W | W | D | D | W | D | D |
Total sum: 19 W, 19 D, 4 L
Charts of absolut error by images:
One percent difference with the same scoring function
These pictures have more or less a difference of one percent of absolute error value. They have simply 1000 string of difference, but otherwise they have the same scoring function.
Left: n:abstract1-s:25001-p:240-ao:9-do:9-sf:equilibrate-e:34134255.jpg
Right: n:abstract1-s:24001-p:240-ao:9-do:9-sf:equilibrate-e:35072259.jpg
Left: n:abstract1-s:25001-p:240-ao:9-do:9-sf:diffOriResult-e:33484740.jpg
Right: n:abstract1-s:24001-p:240-ao:9-do:9-sf:diffOriResult-e:34507232.jpg
Left: n:dance1-s:28001-p:240-ao:9-do:9-sf:equilibrate-e:22705721.jpg
Right: n:dance1-s:27001-p:240-ao:9-do:9-sf:equilibrate-e:24203691.jpg
Left: n:starik1-s:14001-p:240-ao:9-do:9-sf:diffOriResult-e:29942740.jpg
Right: n:starik1-s:13001-p:240-ao:9-do:9-sf:diffOriResult-e:31255929.jpg
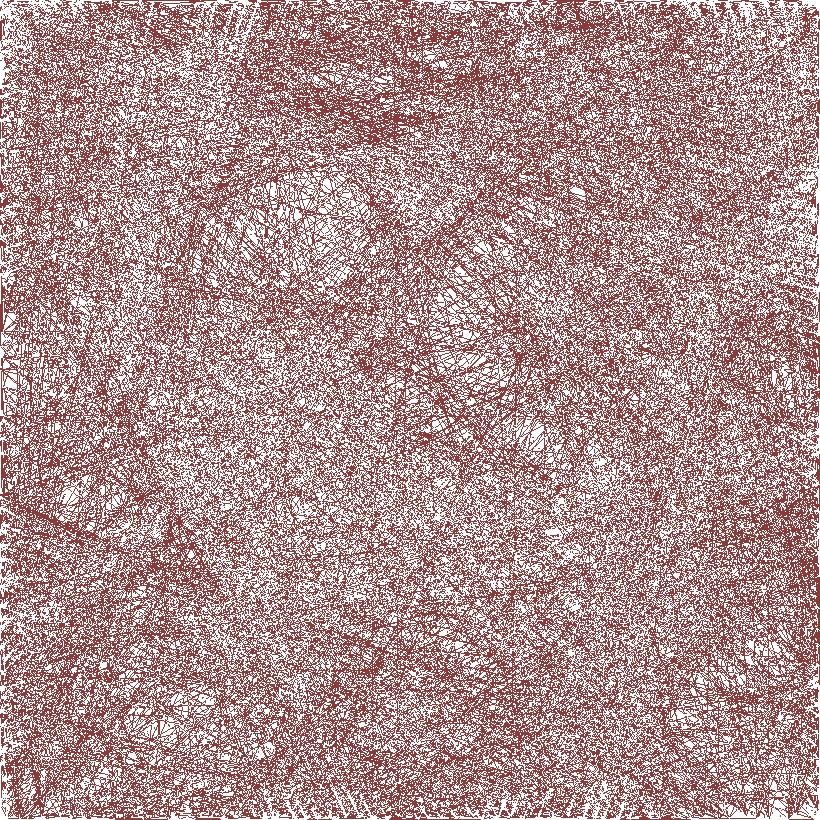
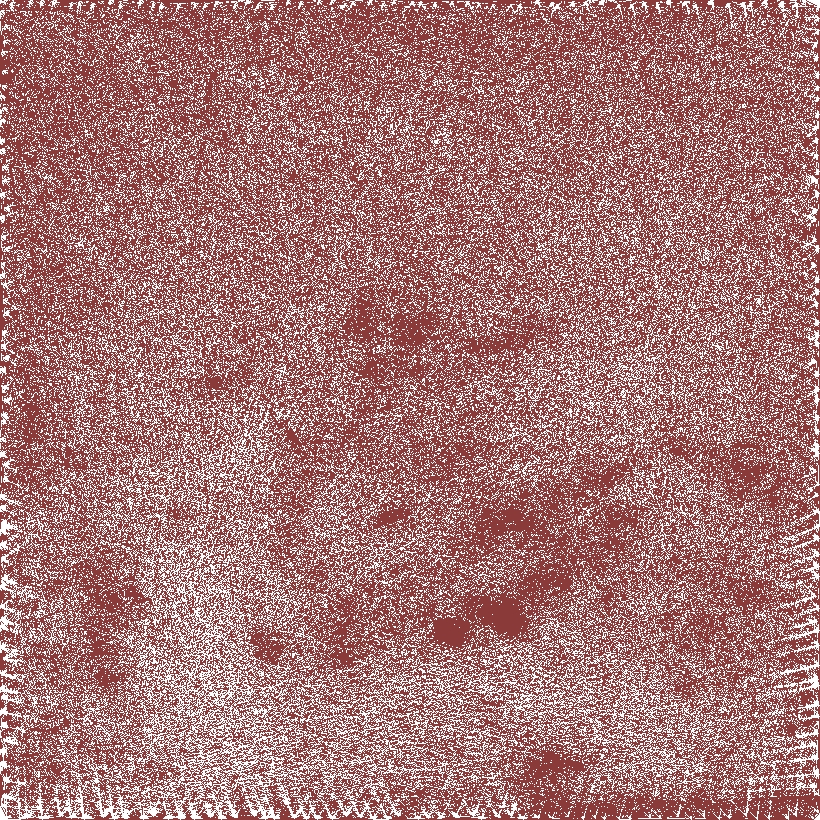
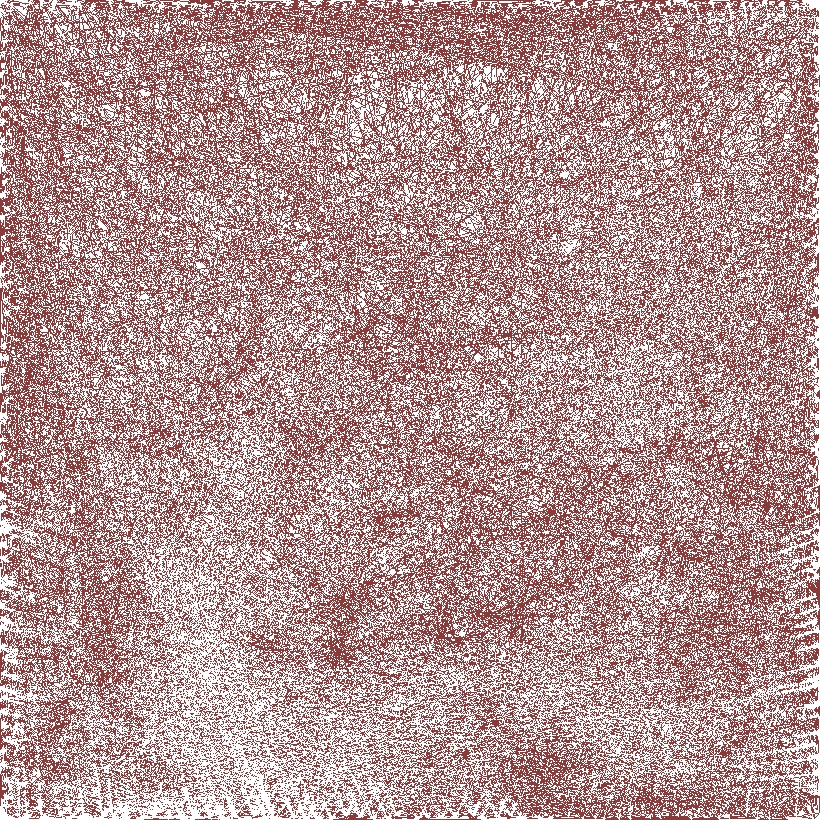
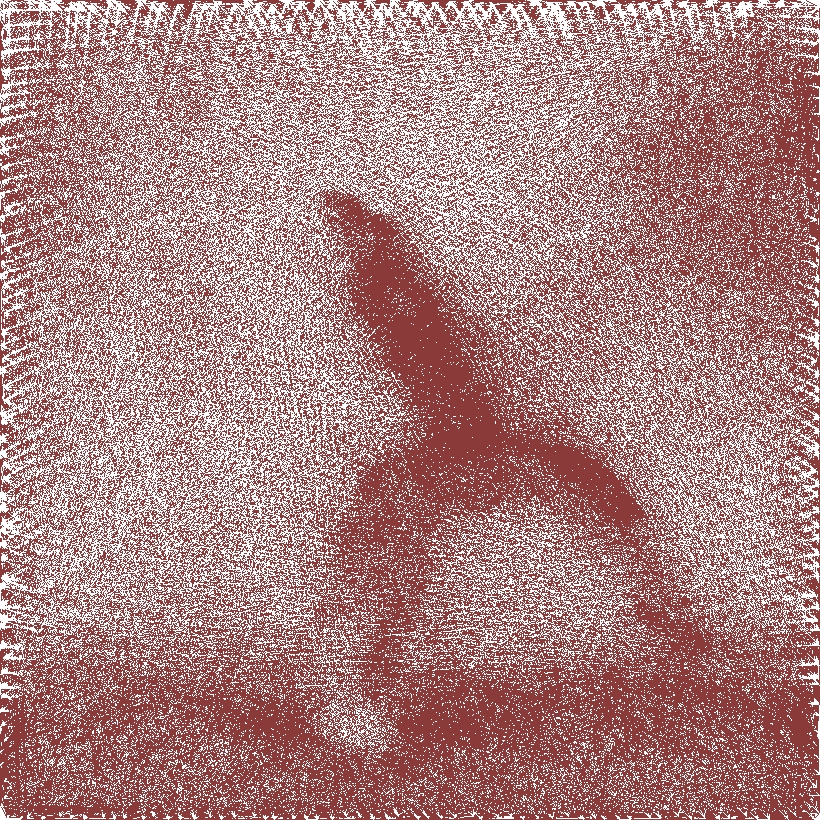
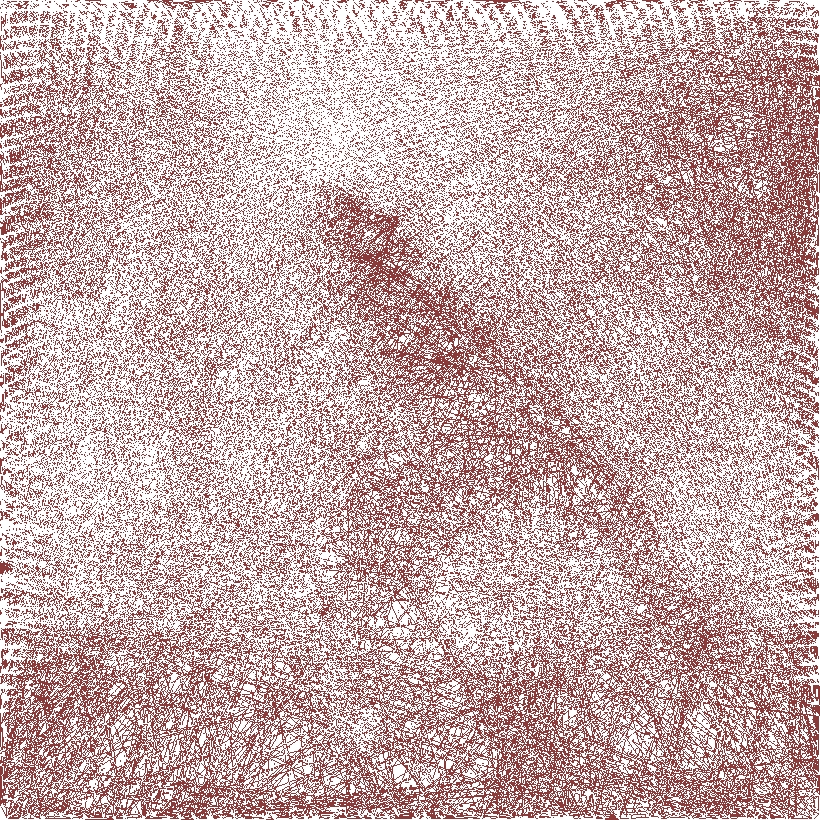
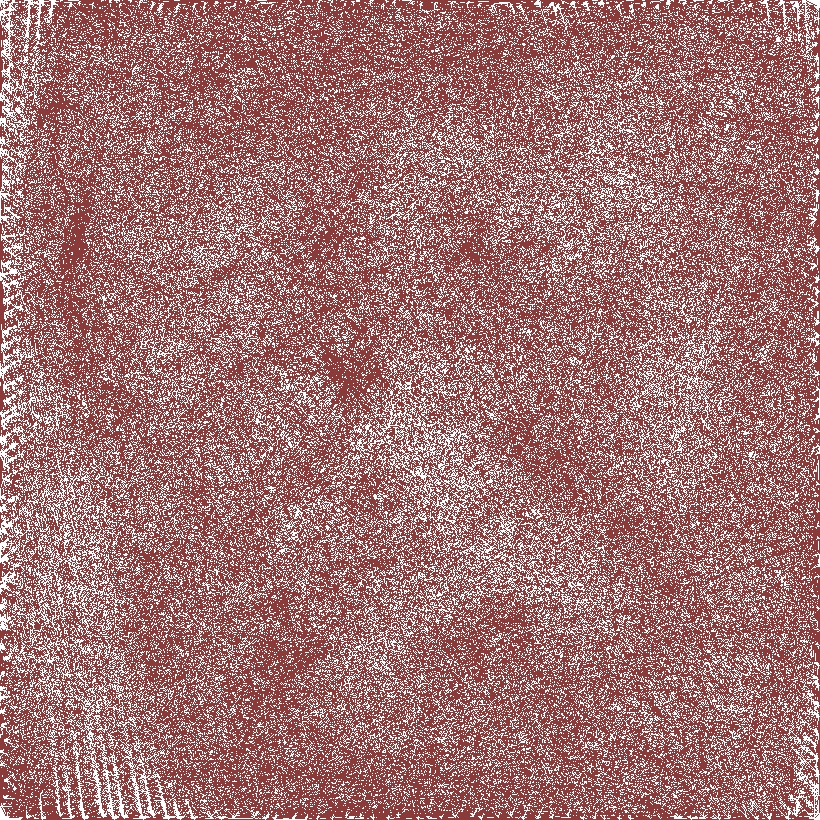
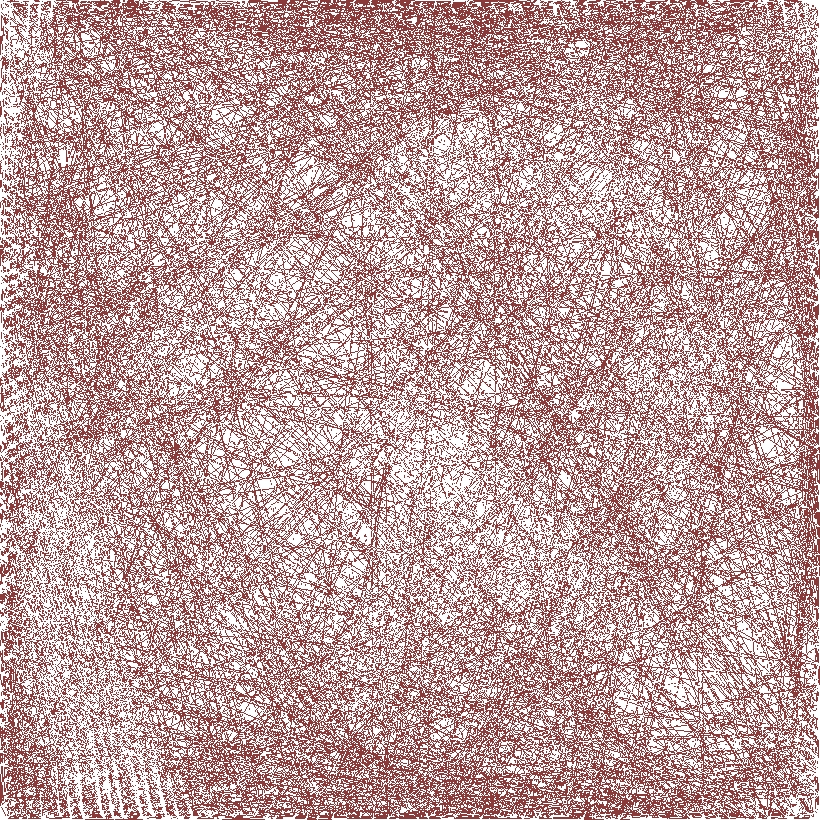
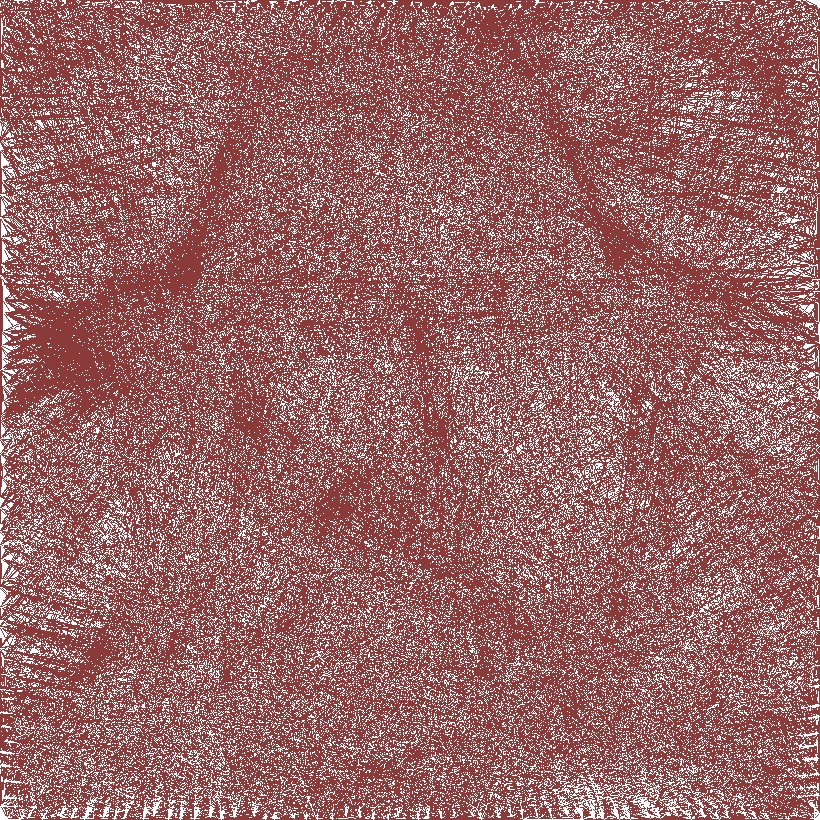
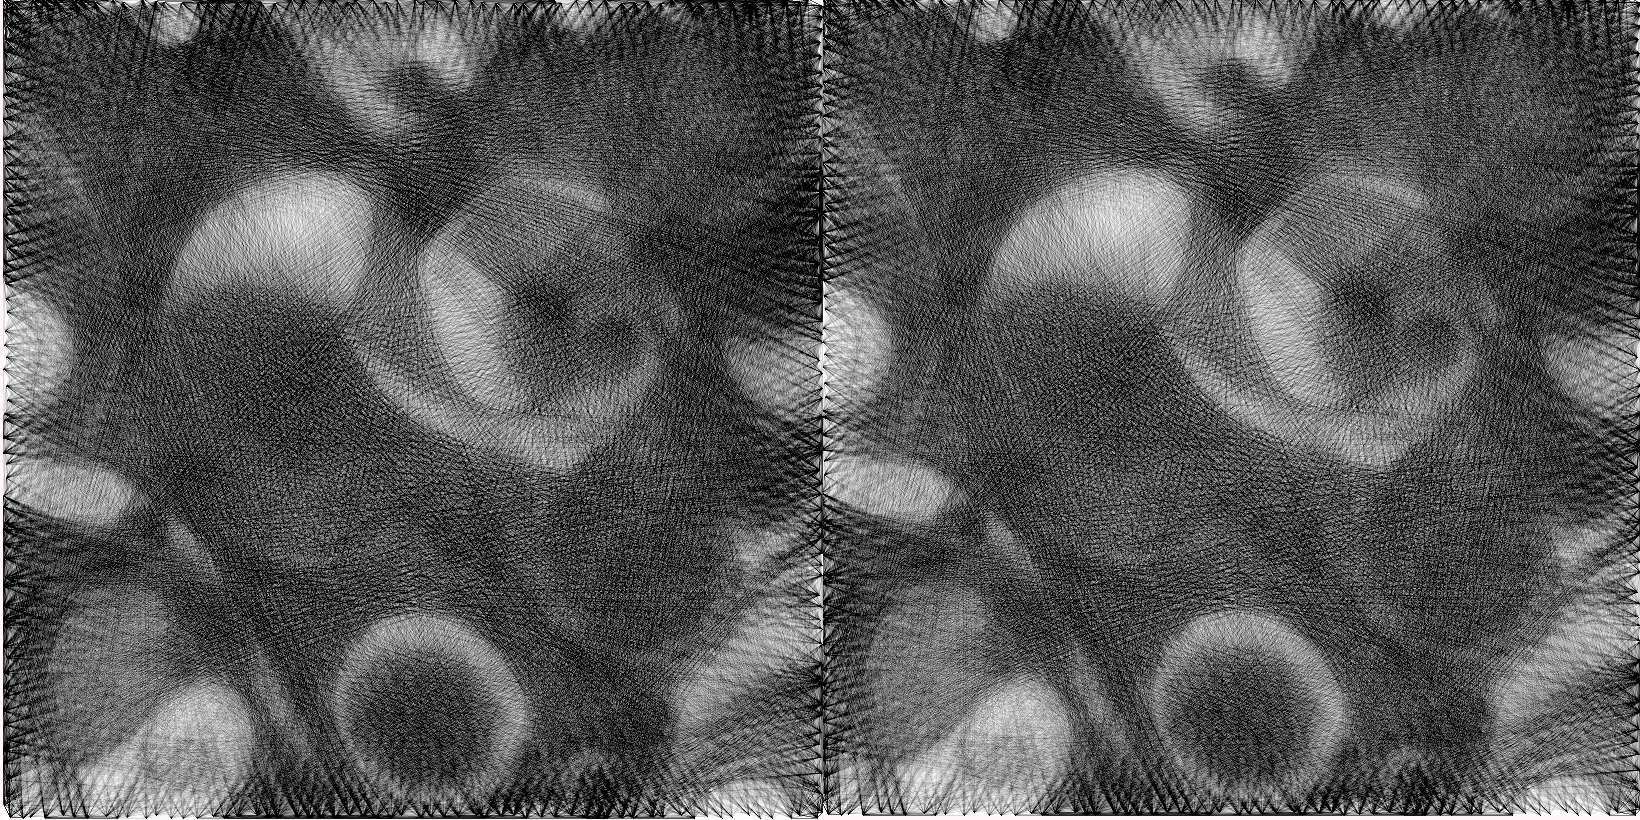
Gif of differences between lineScore and diffOriResultLineScore:
For every image bellow:
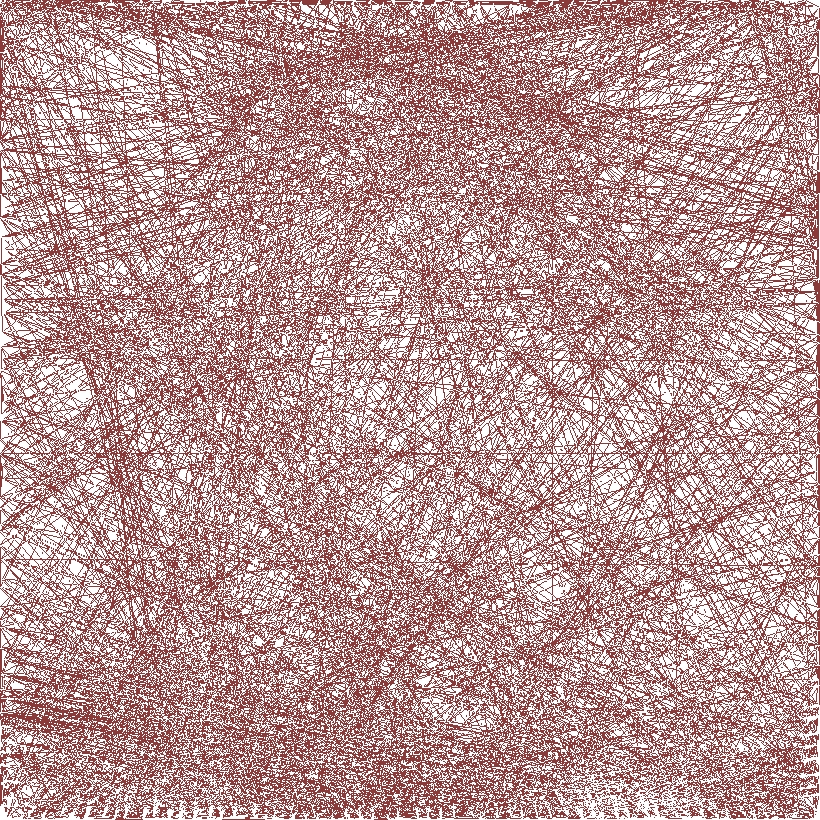
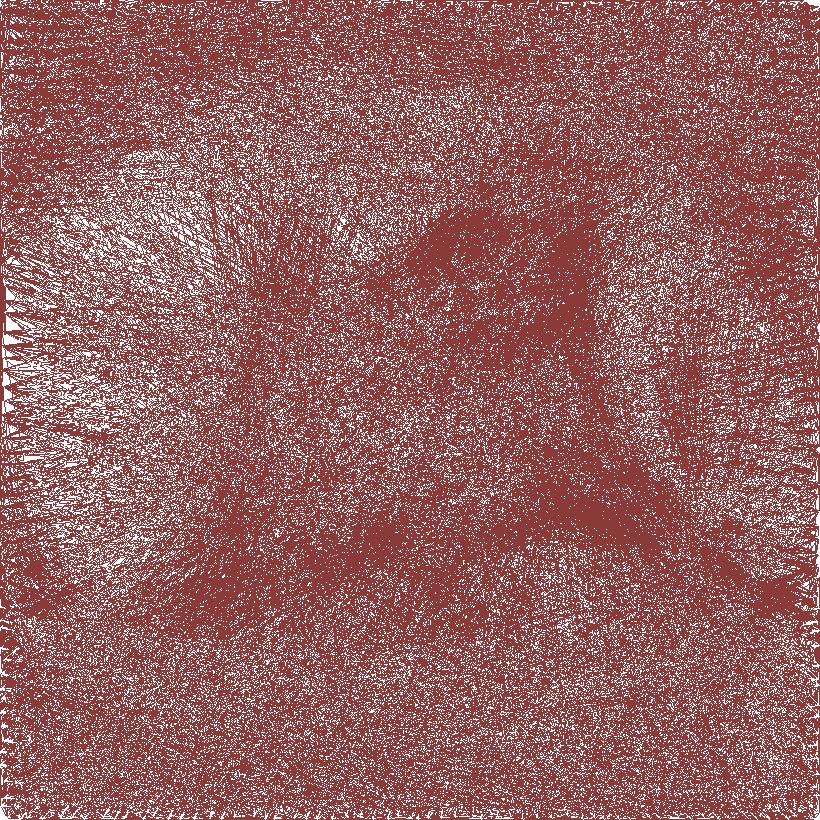
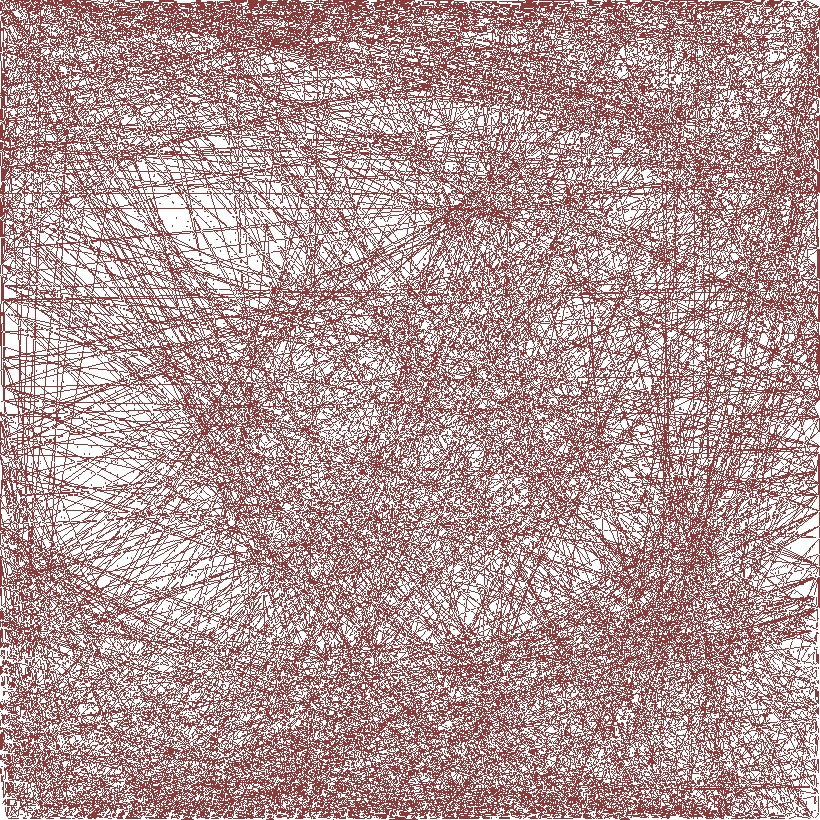
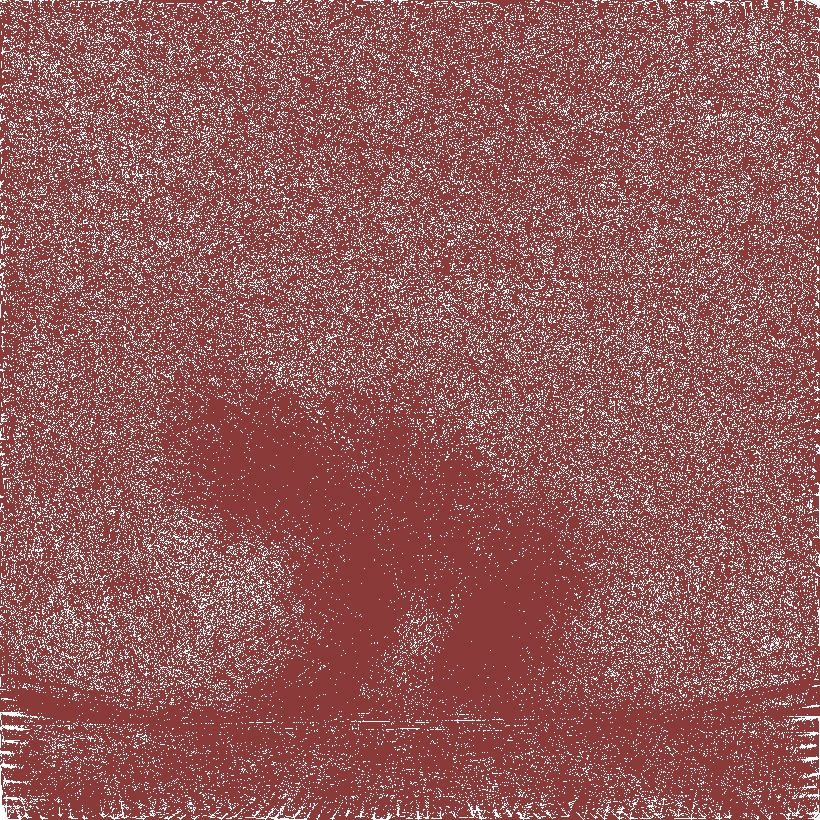
Top Left : image using lineScore
Top Right: image using lineScore
Bottom Left: difference between lineScore and diffOriResult at each step
Bottom Right: image originale


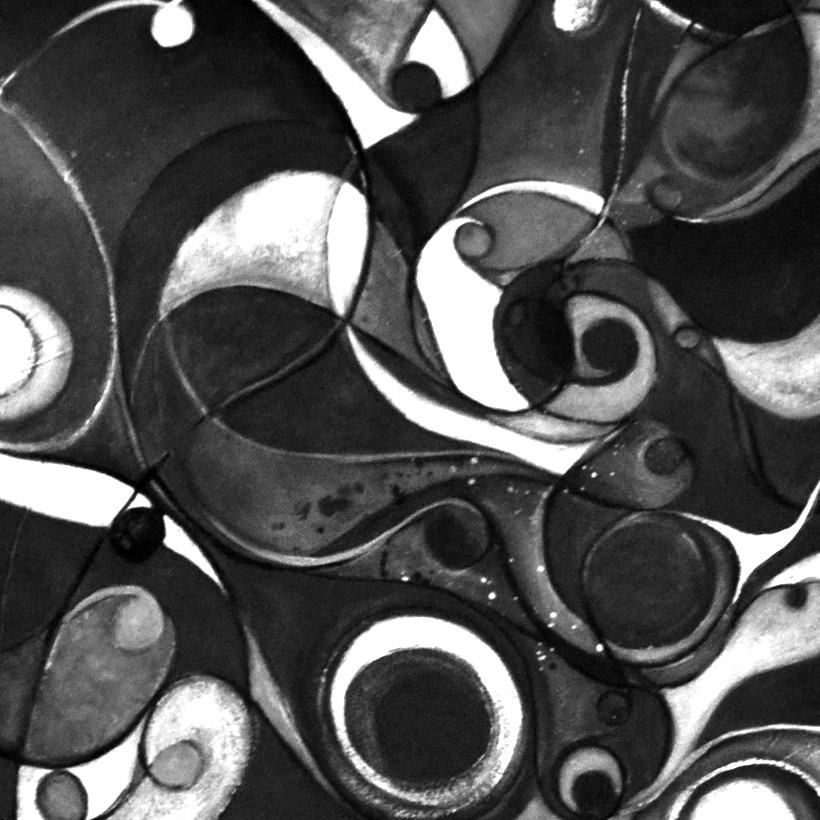


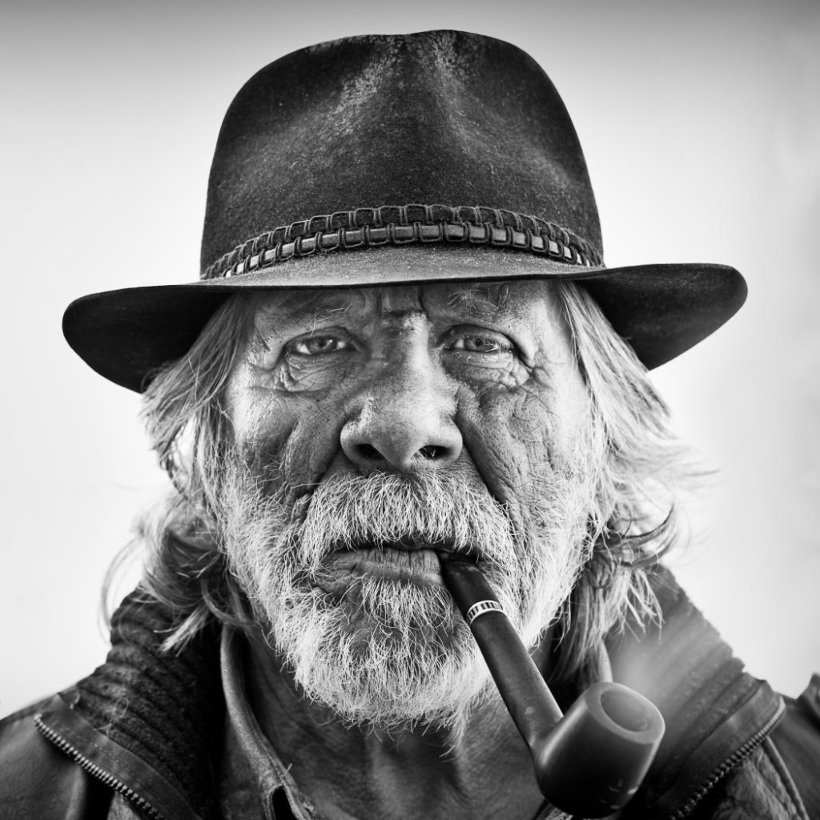


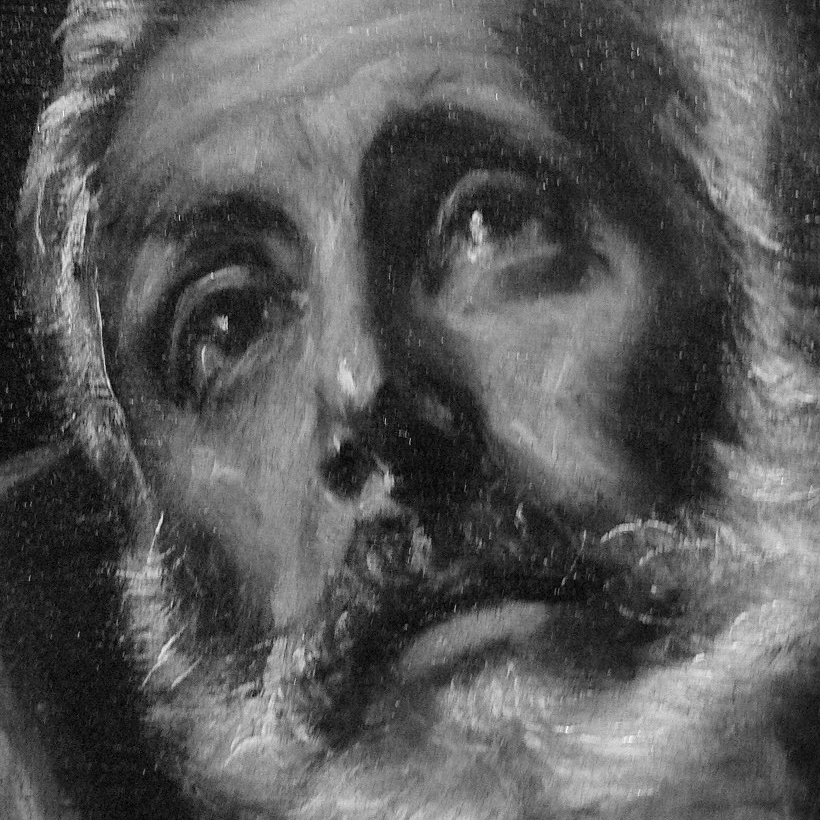


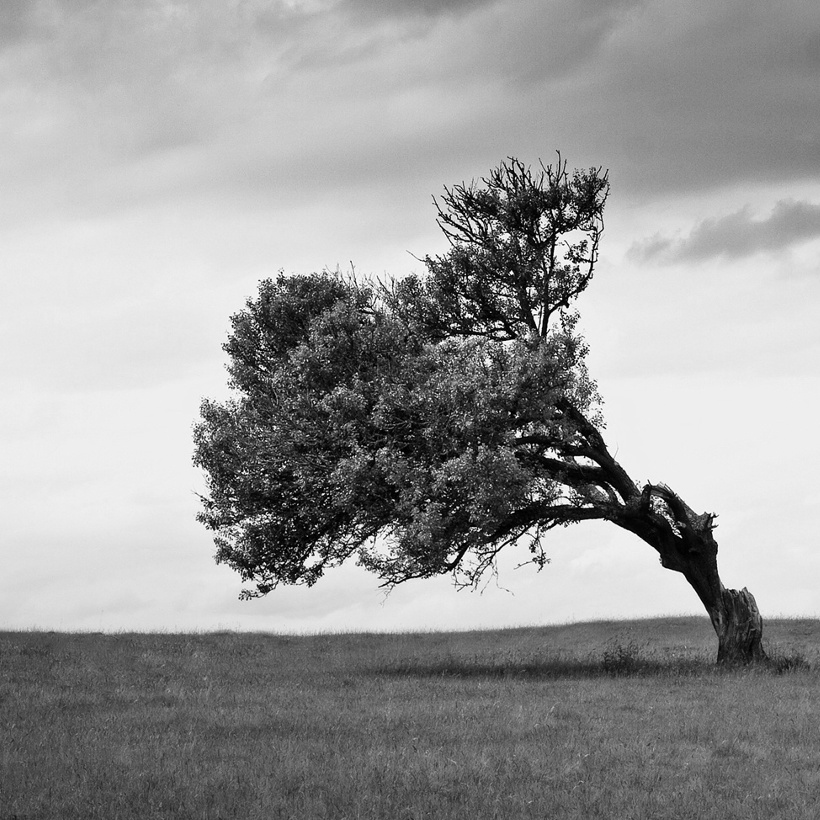


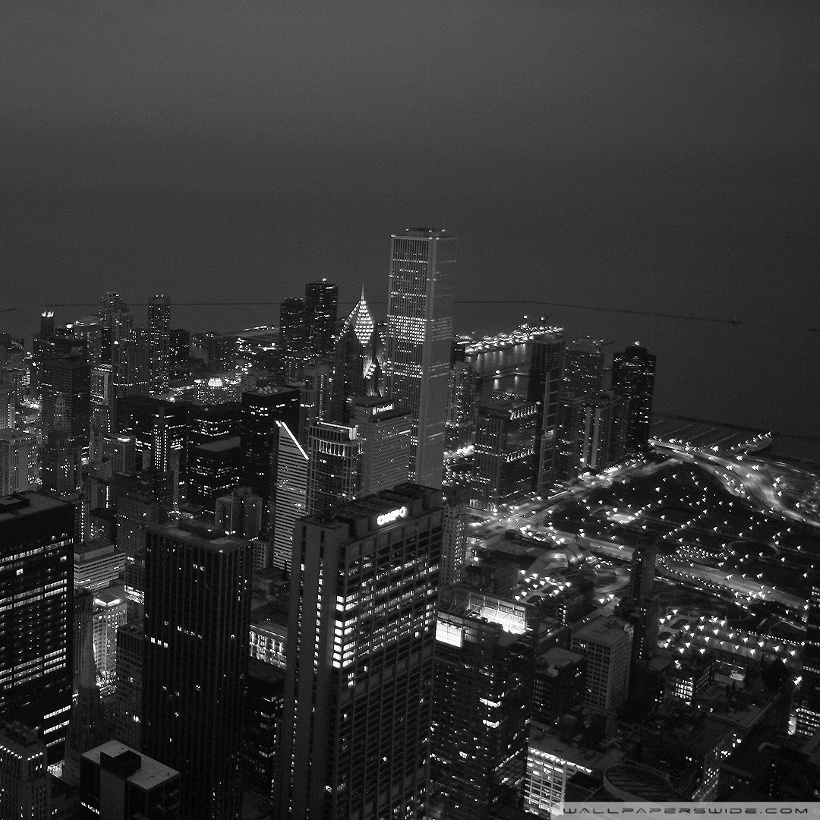


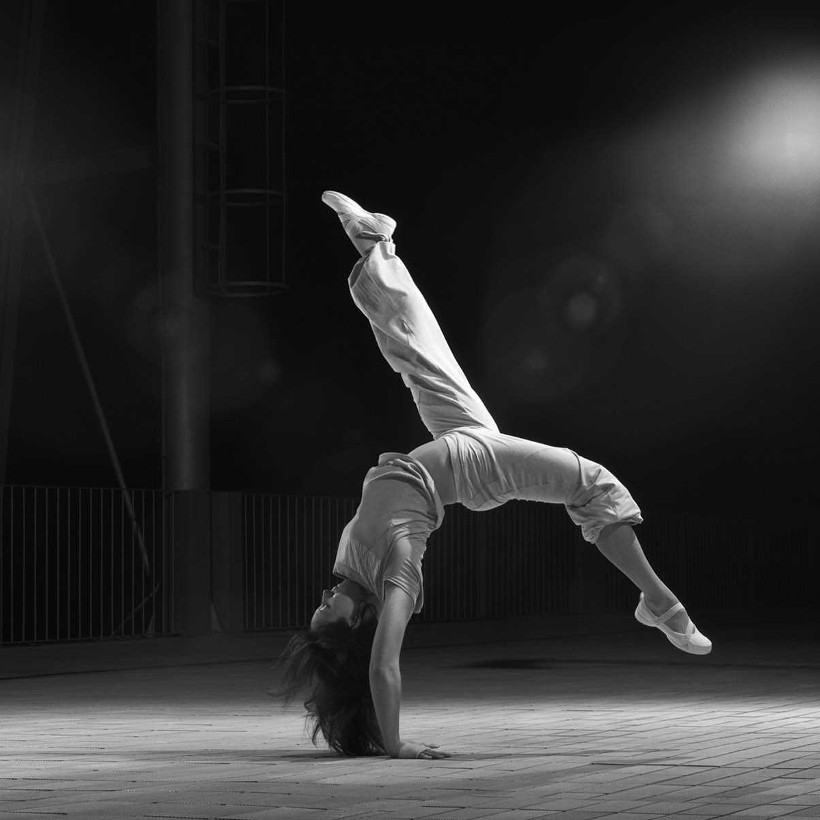


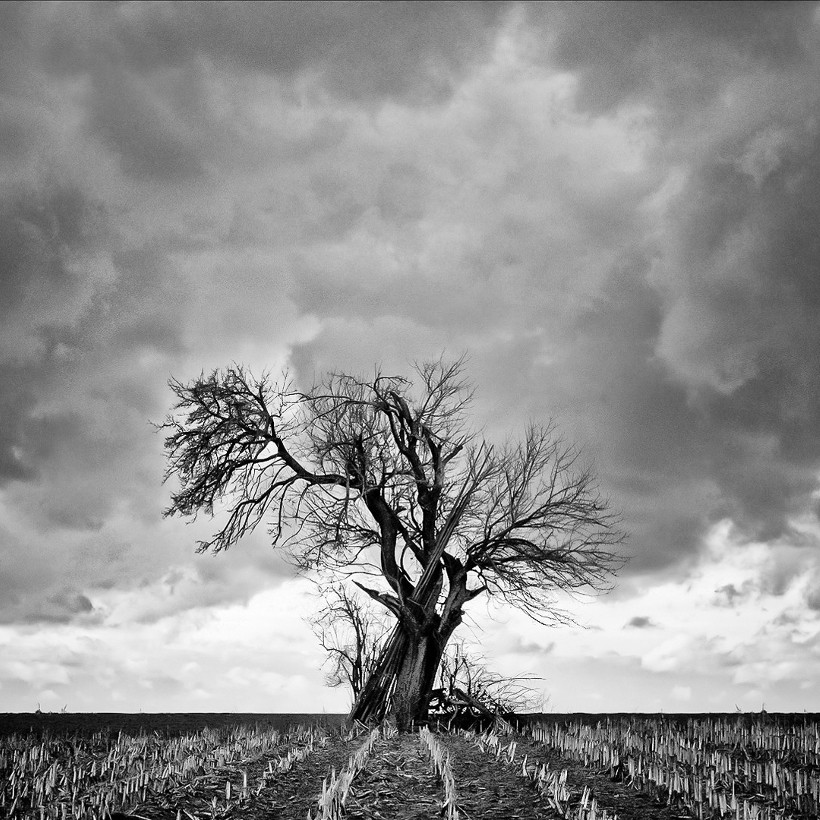
image1: image using lineScore
image2: image using lineScore
image3: difference between lineScore and diffOriResult at each step
image4: image originale