- français
- English
Performance
Goals
After the illuminance is computed (this could take some time, get a coffee), the application prompts the user with the goals for each sensors. Each type of sensors has its own defined goals, please refer to a teaching assistant to know what the goals mean for each module.
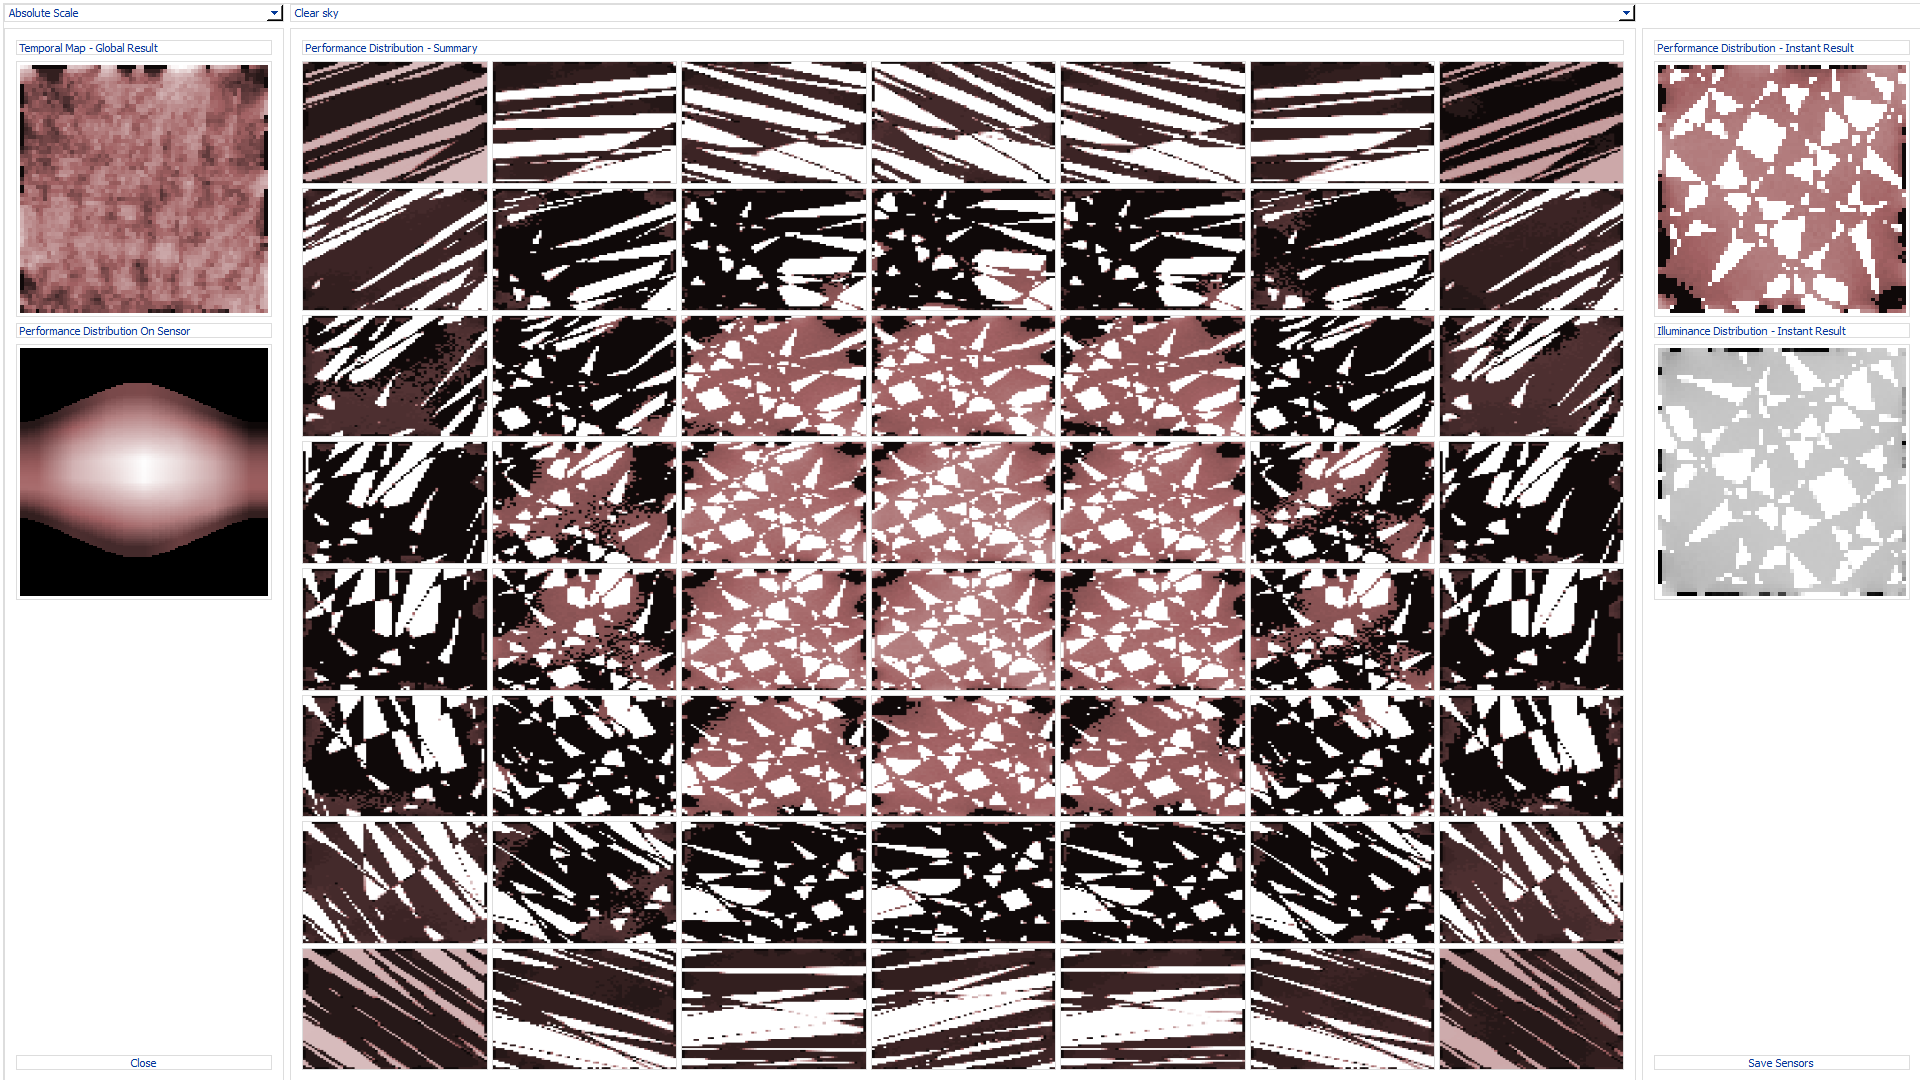
Pink scale
The pink scale is simply a "Matlab pink" linear scale. The values are scaled between white and purple, white meaning an high result in the considered metric and purple being a low result.
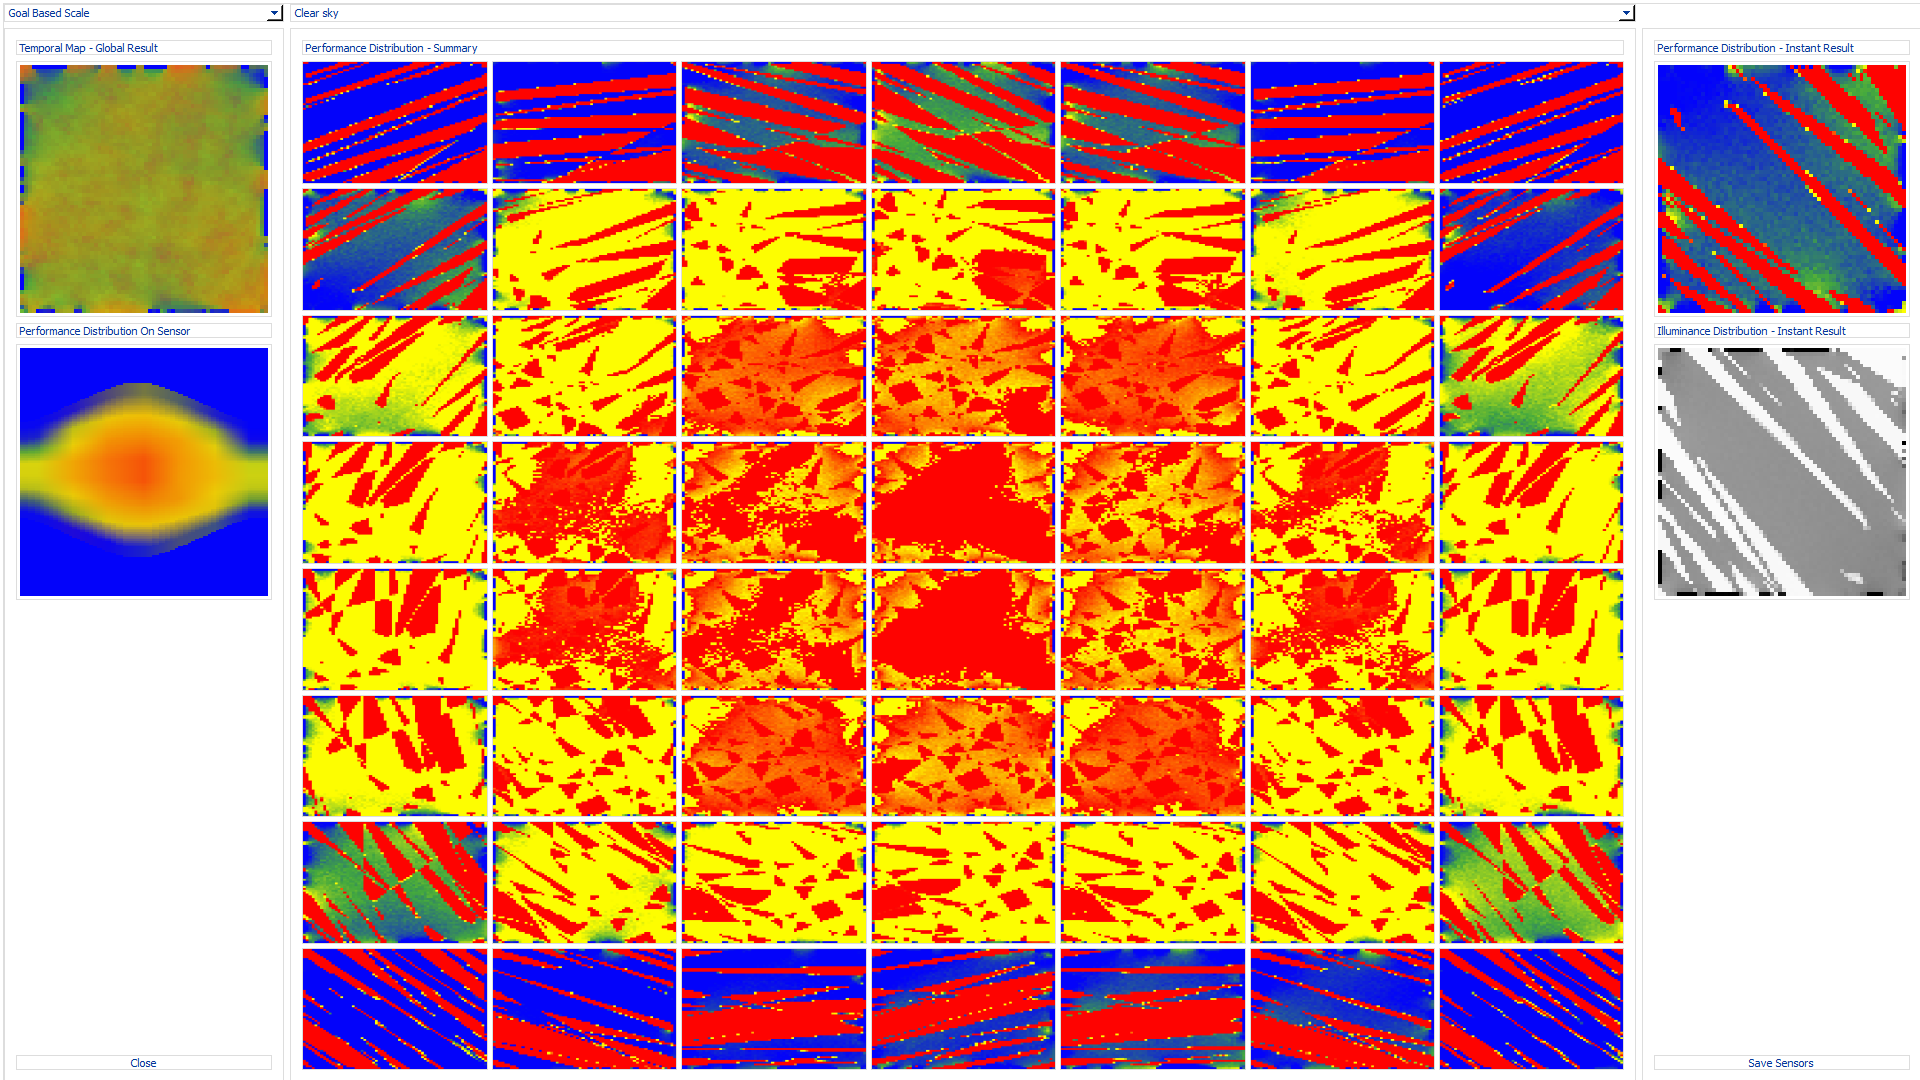
Goal based scale
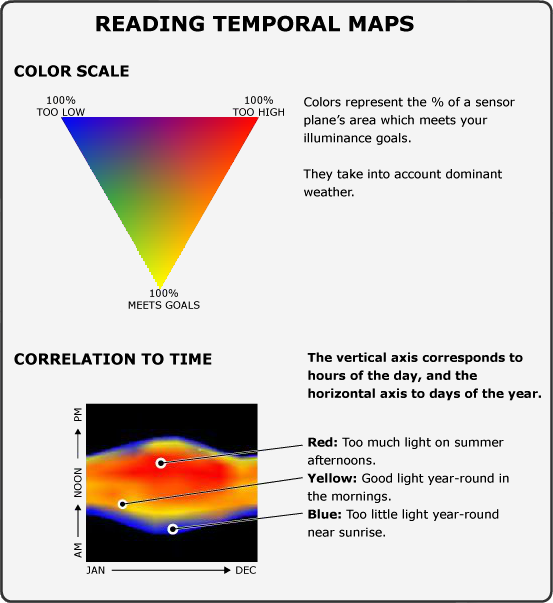
The goal based representation has color codes for the performance, in order to represent both the overall performance metric score of the measured location but also to give a good hint about what moments are critical in terms of performance distribution over the studied surface.
Results
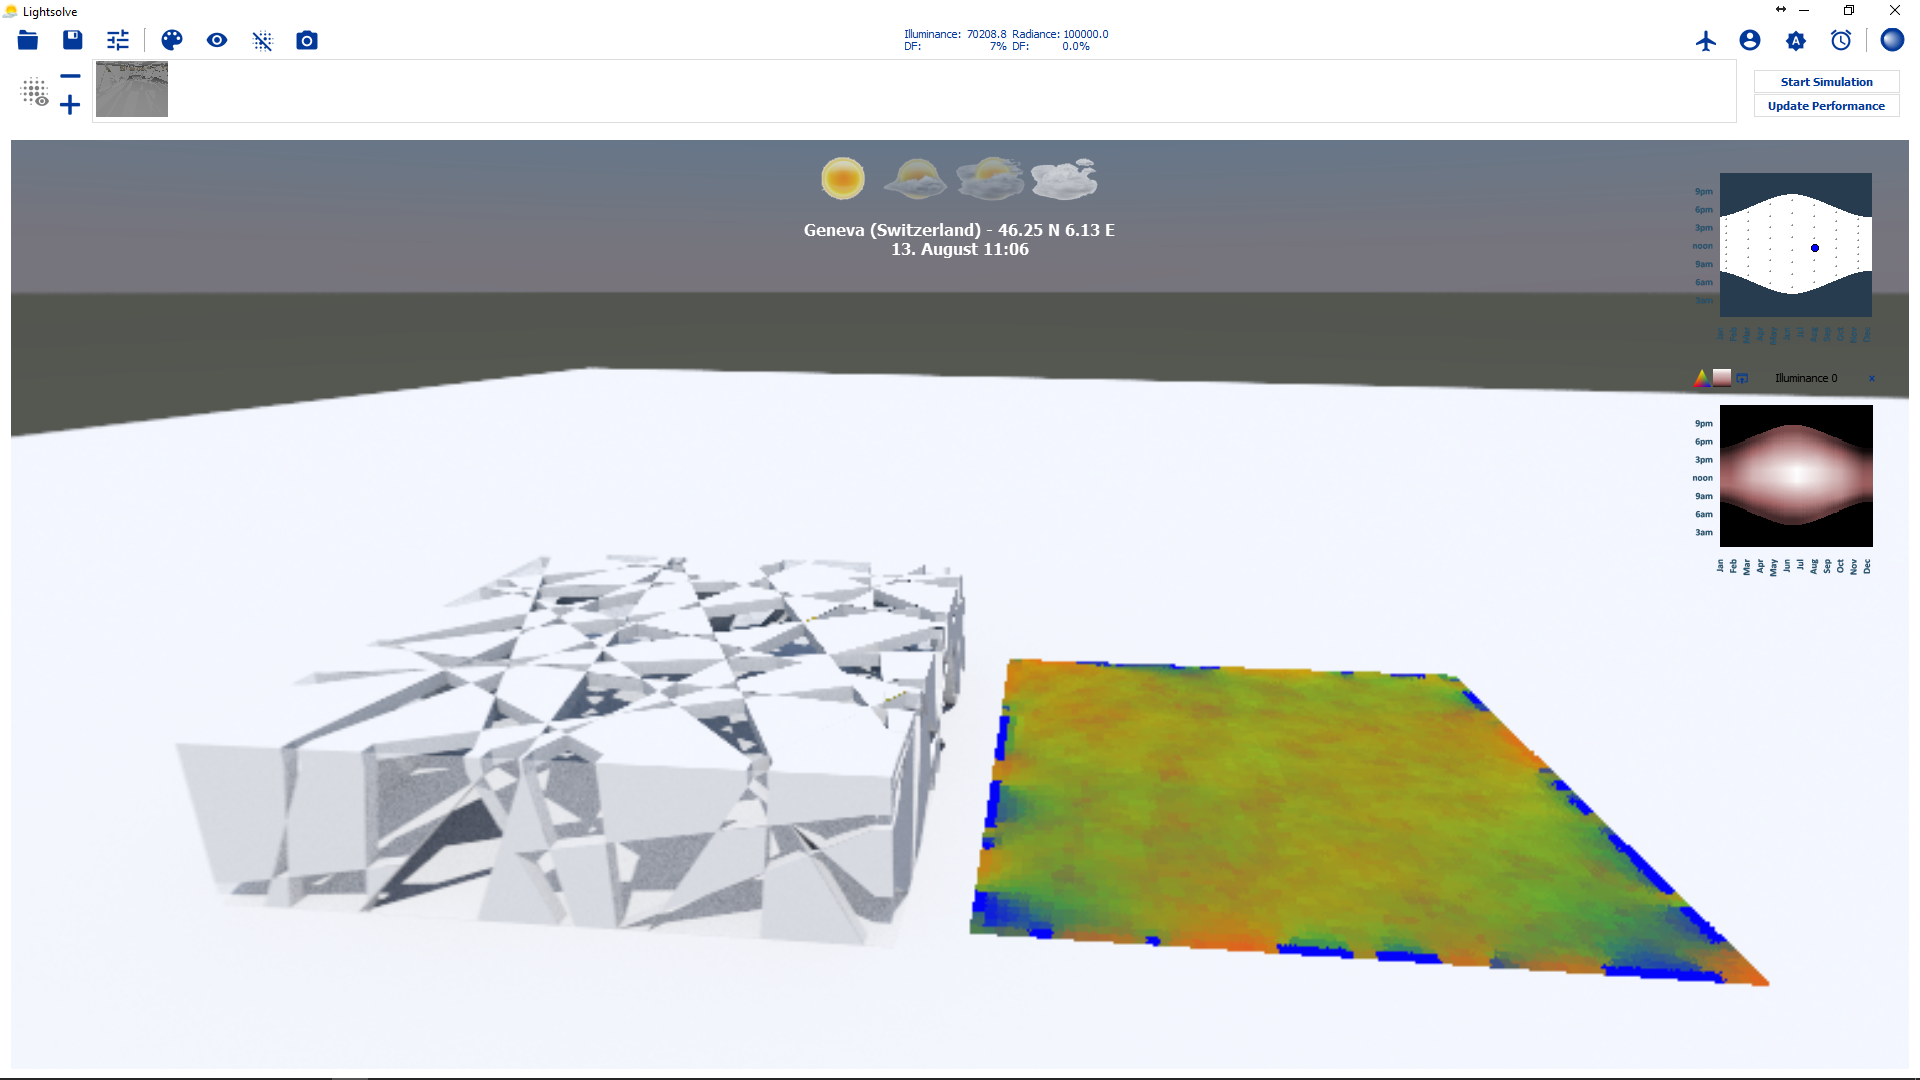
The performance results can then be displayed as an overlay in the 3D scene or as a summary in a grid of images.
You can also export the result to a zip file containing everything related to the sensor: illuminance values in csv readable format, illuminance values as images, luminance images, performance images, yearly images and temporal maps.
The image below shows a sensor after computing the performance. The sensor was covering the whole floor and was moved outside the building for better visualization. The temporal map, in pink scale, is related to the visible surface. In order to show the results panel (see below) you'll need to click the tiny blue icon in the temporal map header.