- français
- English
Preliminary Results
|
Experimental results (complete flow with IECAS numbers before optimization) Area representation (before optimization) Delay comparison (IECAS/FPGA'12 before optimization) Delay/Area comparison (IECAS/FPGA'12 after optimization) Preliminary results (after optimization)
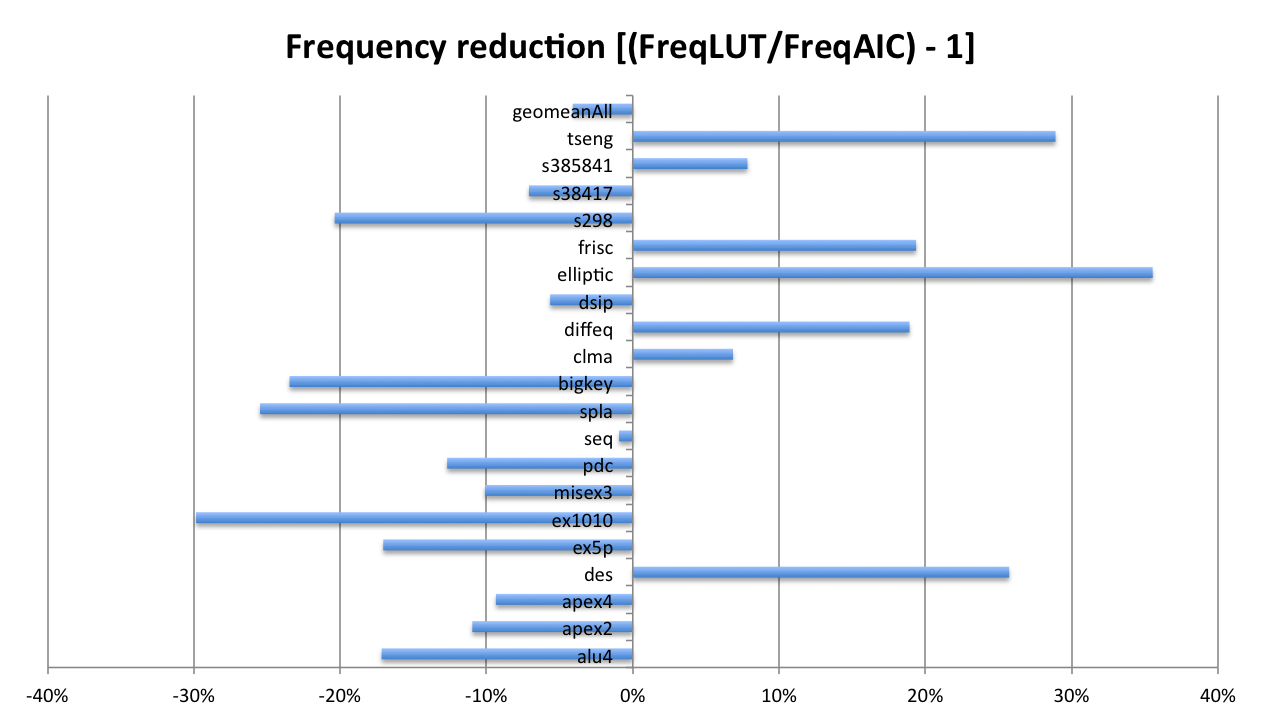
A set of experiments is designed to study the sensitivity of maximum achievable frequency with respect to some of the packing options. The experimental setup is the following:
- 72 flag variants were used (including 24 packing options x 3 different seeds).
- 5 VPR benchmarks (the fastest ones) processed for AIC and LUT mapping, respectively. The option with the default flags is colored in red and in a lighter color the same default packing options but with different seeds.

Conclusions:
- For AICs we observe a huge variability, with more than 70% frequency increase for some cases!! For example, the same packing options for ch_intrinsics result in 220, 289 or 335MHz (more than 50% increase) depending ONLY on the seeds.
- LUTs experience a smaller variability than AICs, but LUT variability is still quite relevant (40% in some cases).
|
|||||||||||||||||||||||||||||||||||||
|
A set of experiments is designed to study the utilization of AICs when mapping a set of representative circuits. The experimental setup is the following:
- 17 VPR benchmarks (all but the 2 largest ones).
- For each benchmark we count the number of inputs of each type of cone that are different from gnd (which is only used for bypassing and not real computation).
For example the following 6-level Cone has 50 inputs connected to gnd, leading to a 78.1% ground occupation.
For a benchmark, we can see the number of cones with a particular ground occupation per type of cone:
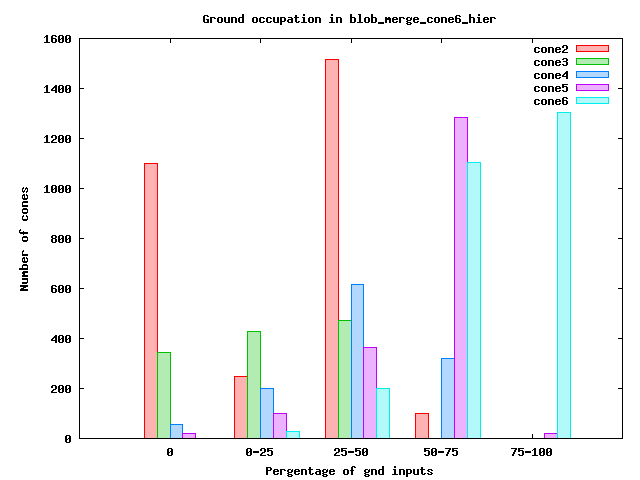
Conclusions:
- We observe a substantial amount of big AICs that are largely underutilized.
- We should explore some local restructuring to see whether the size of the cones can be reduced while keeping the same functionality.
|
|||||||||||||||||||||||||||||||||||||
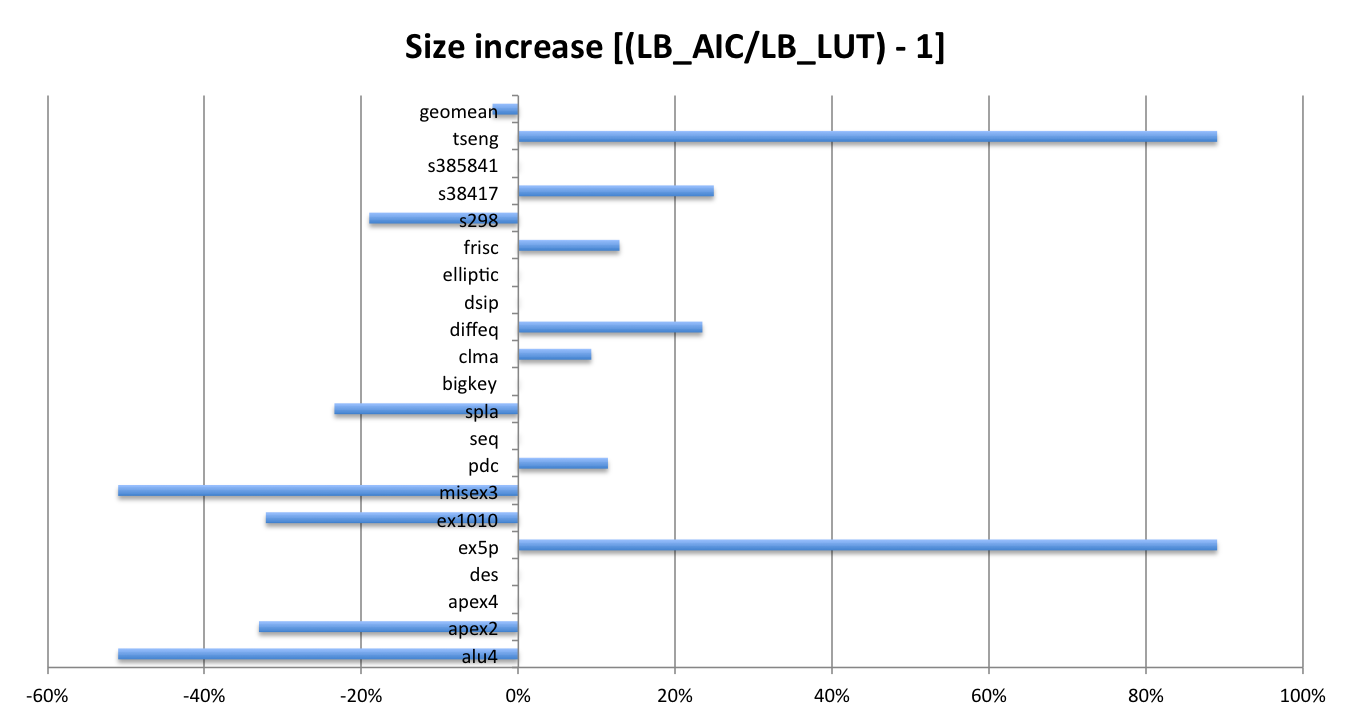
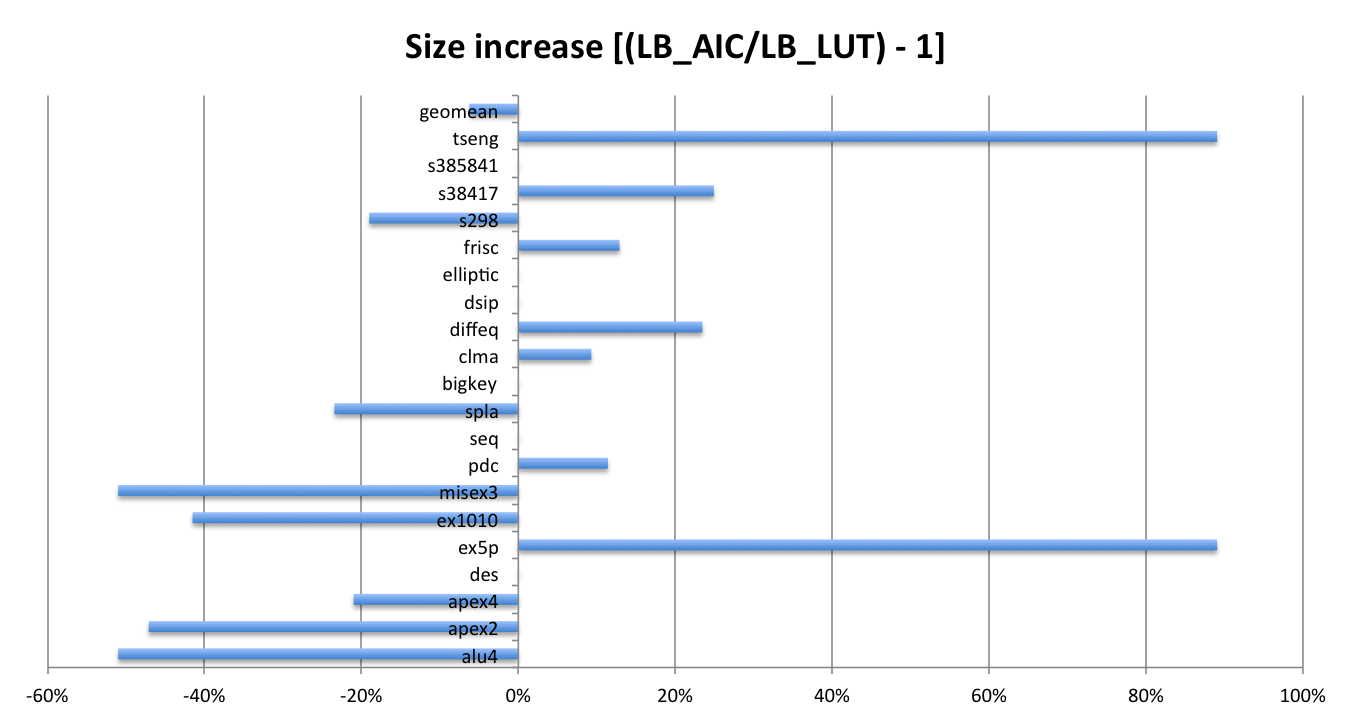
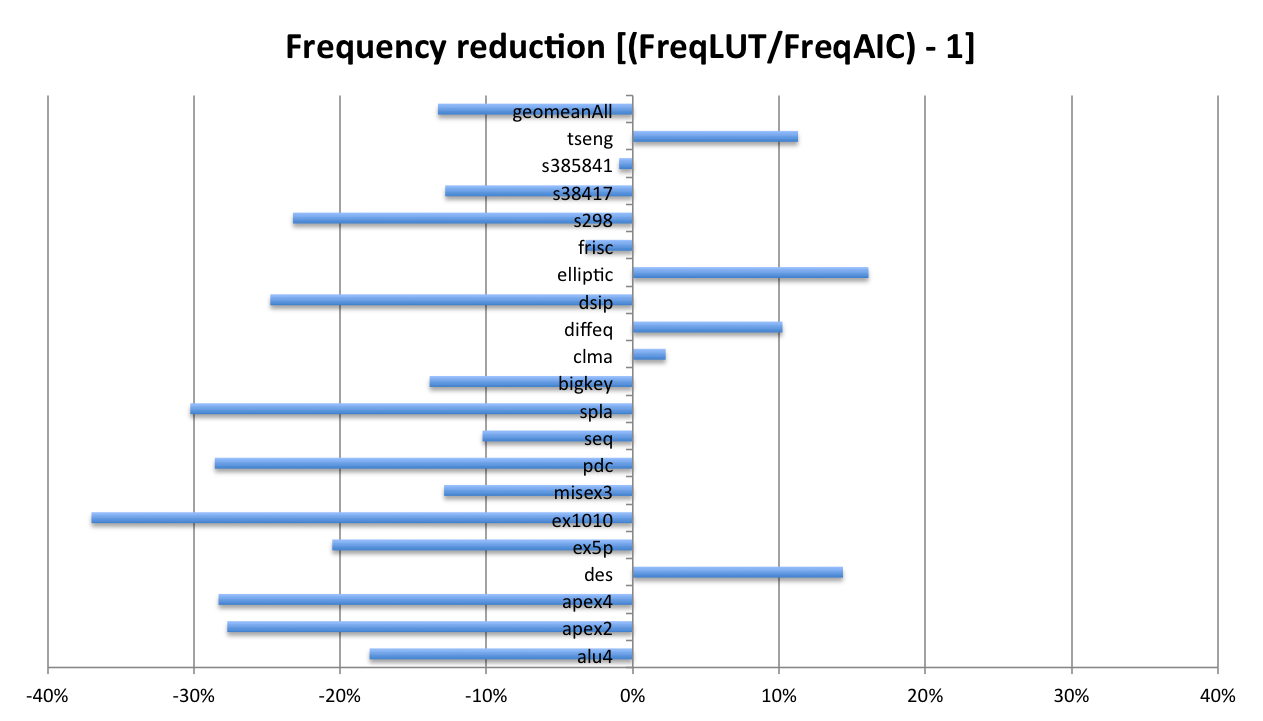
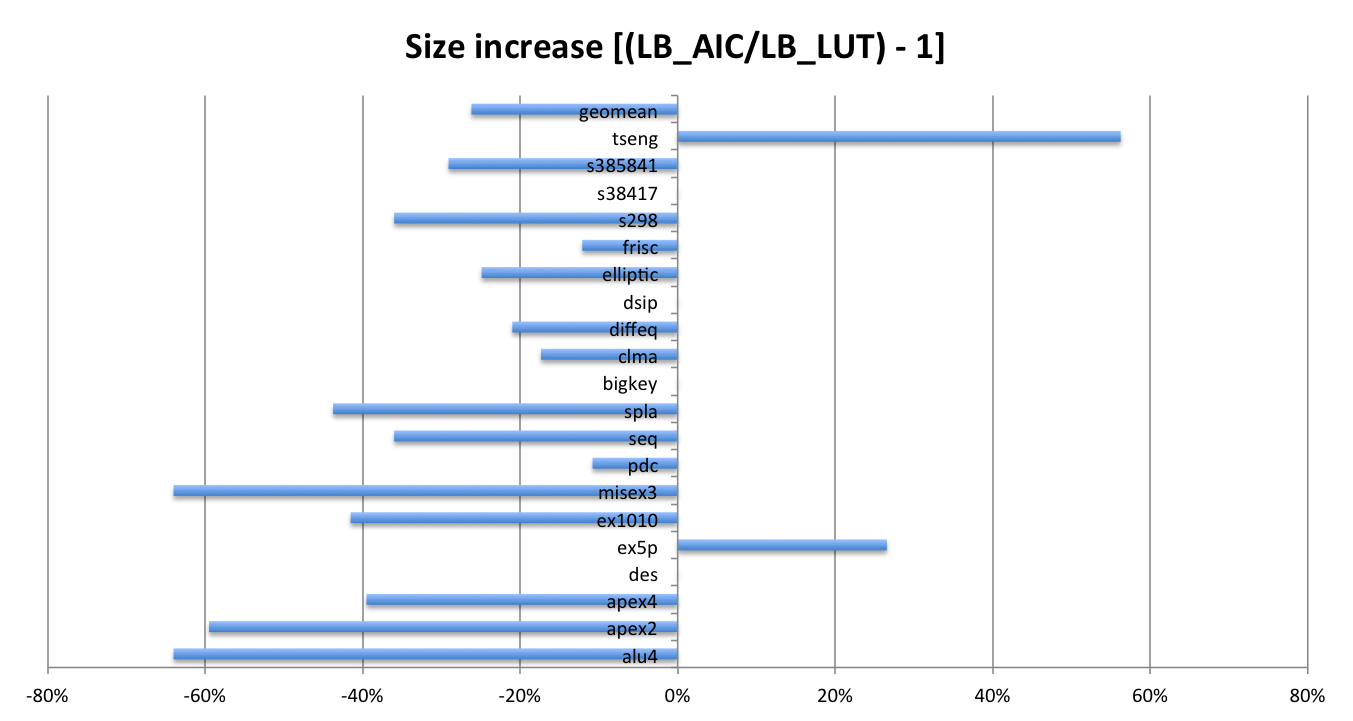
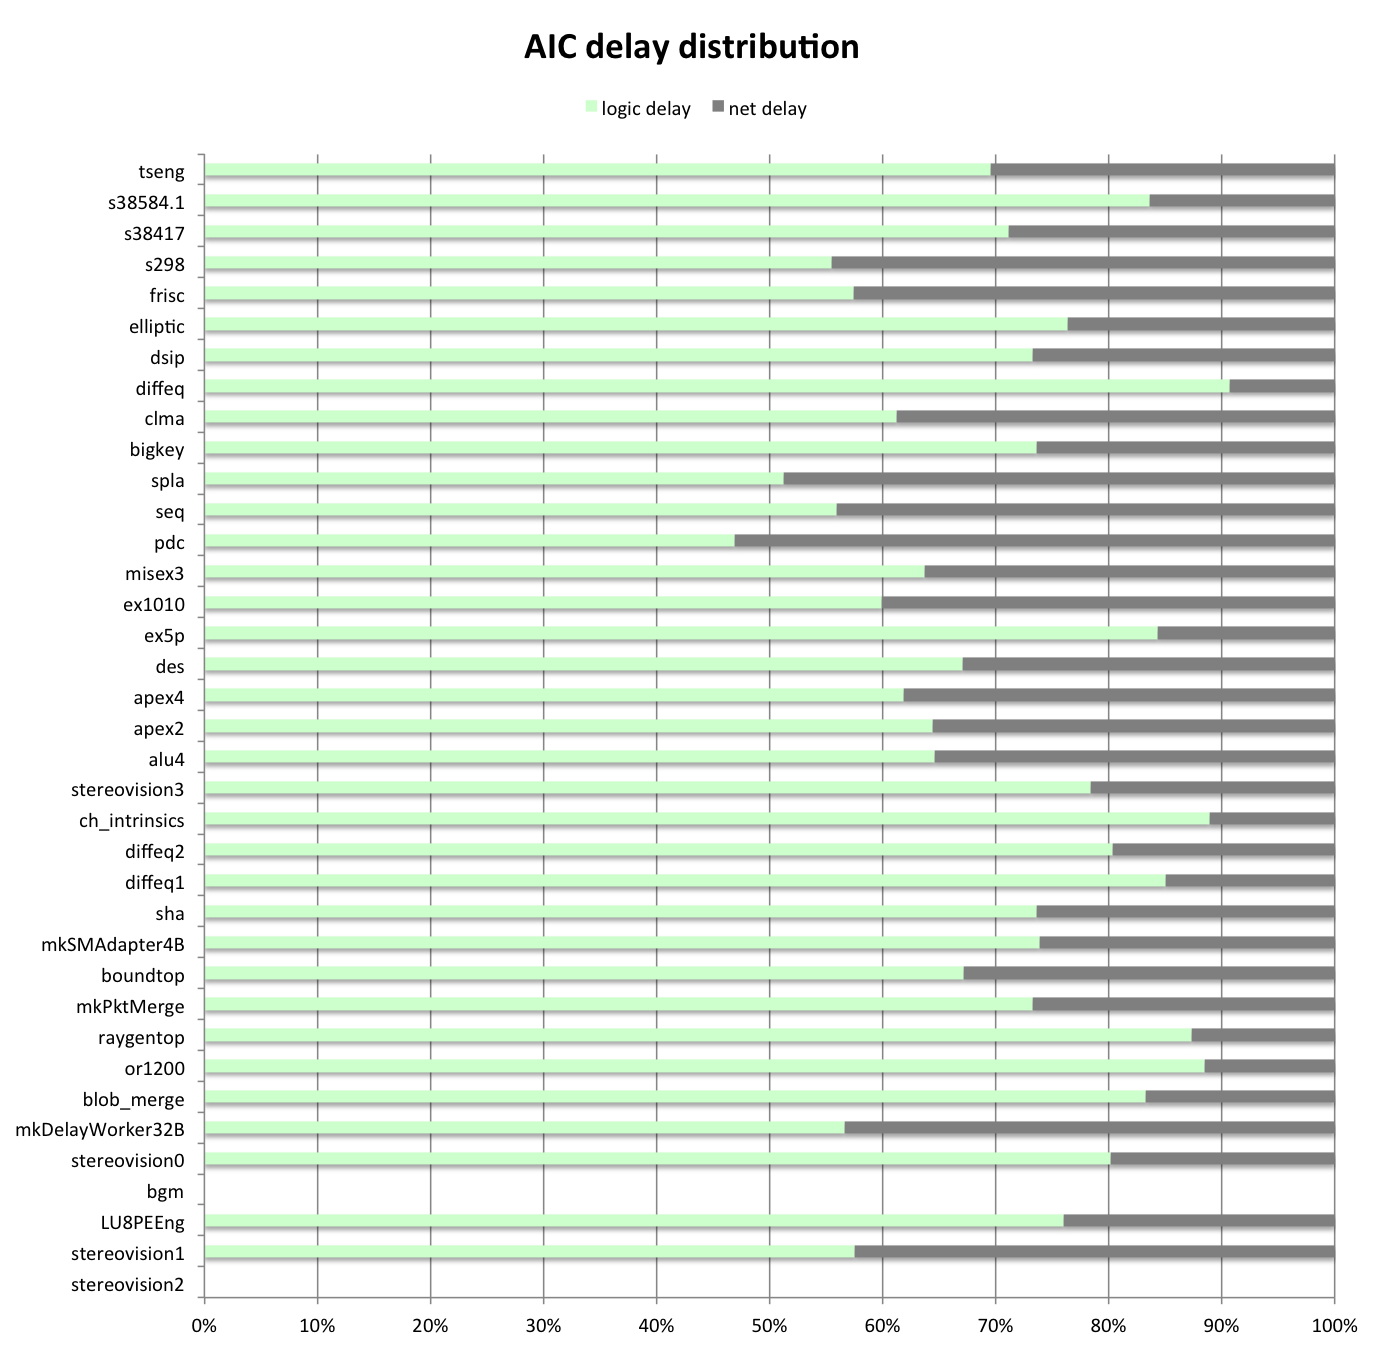
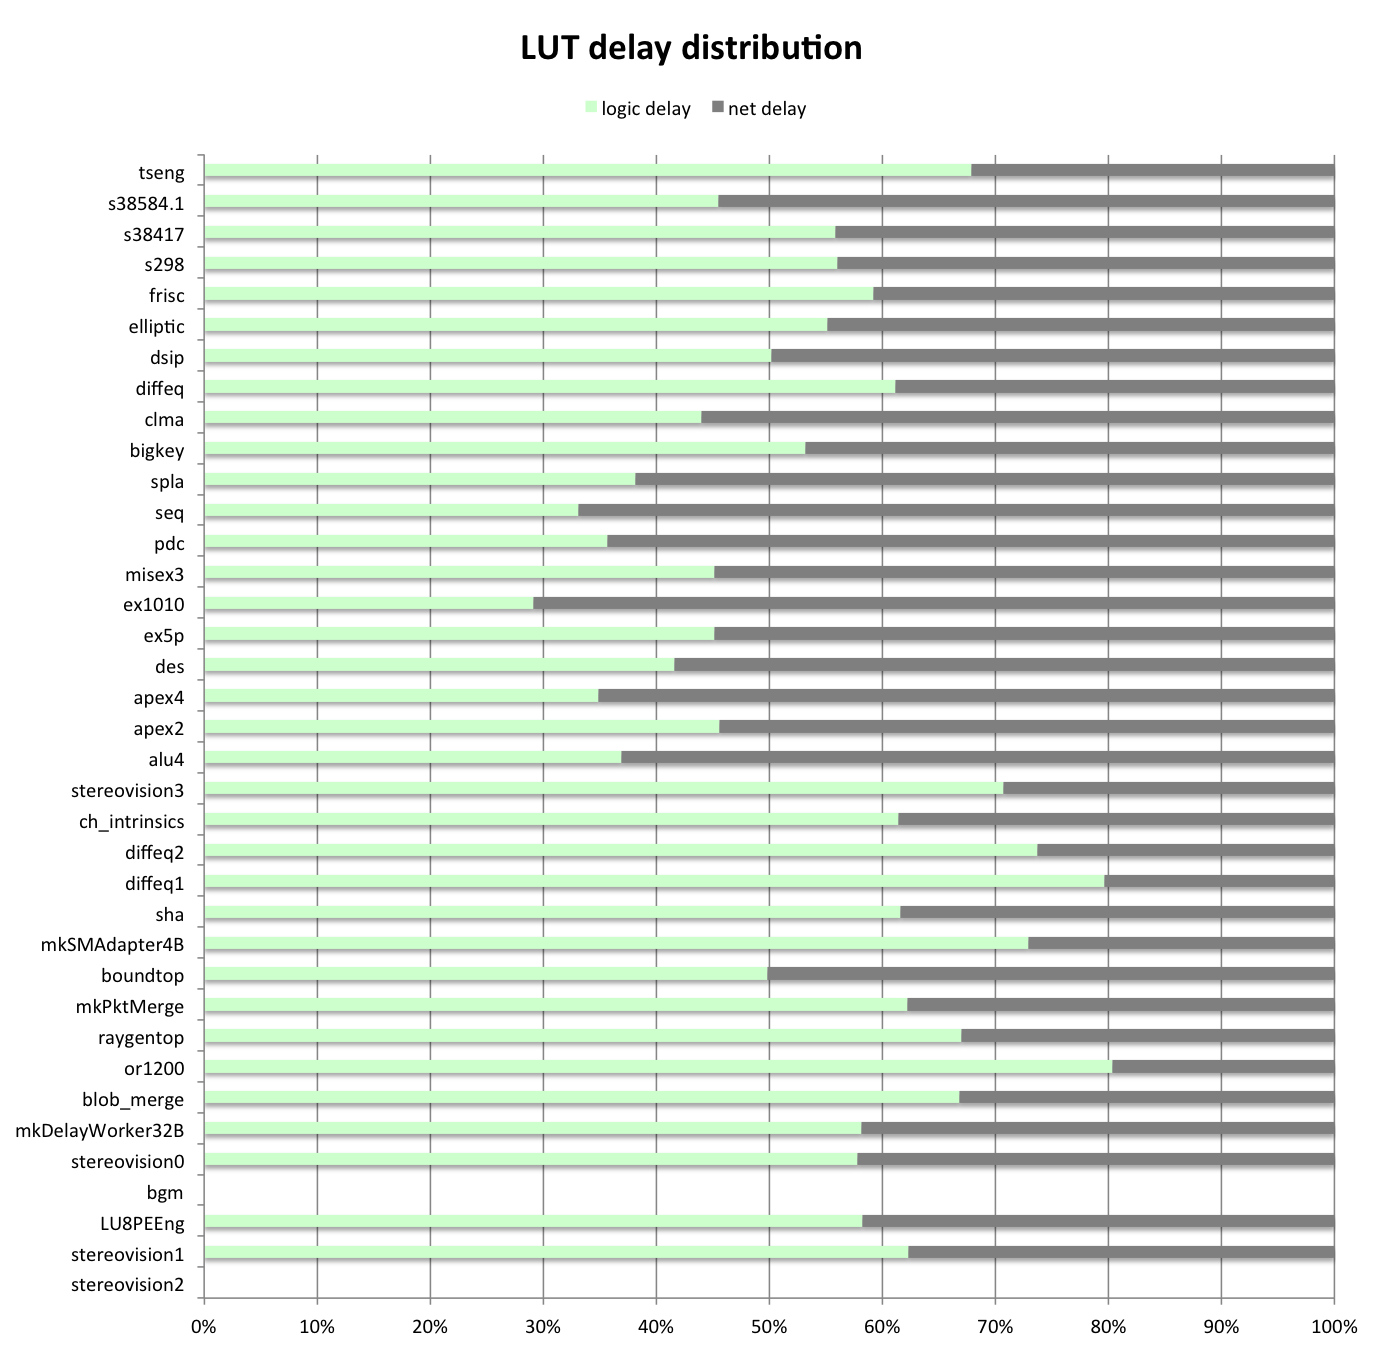
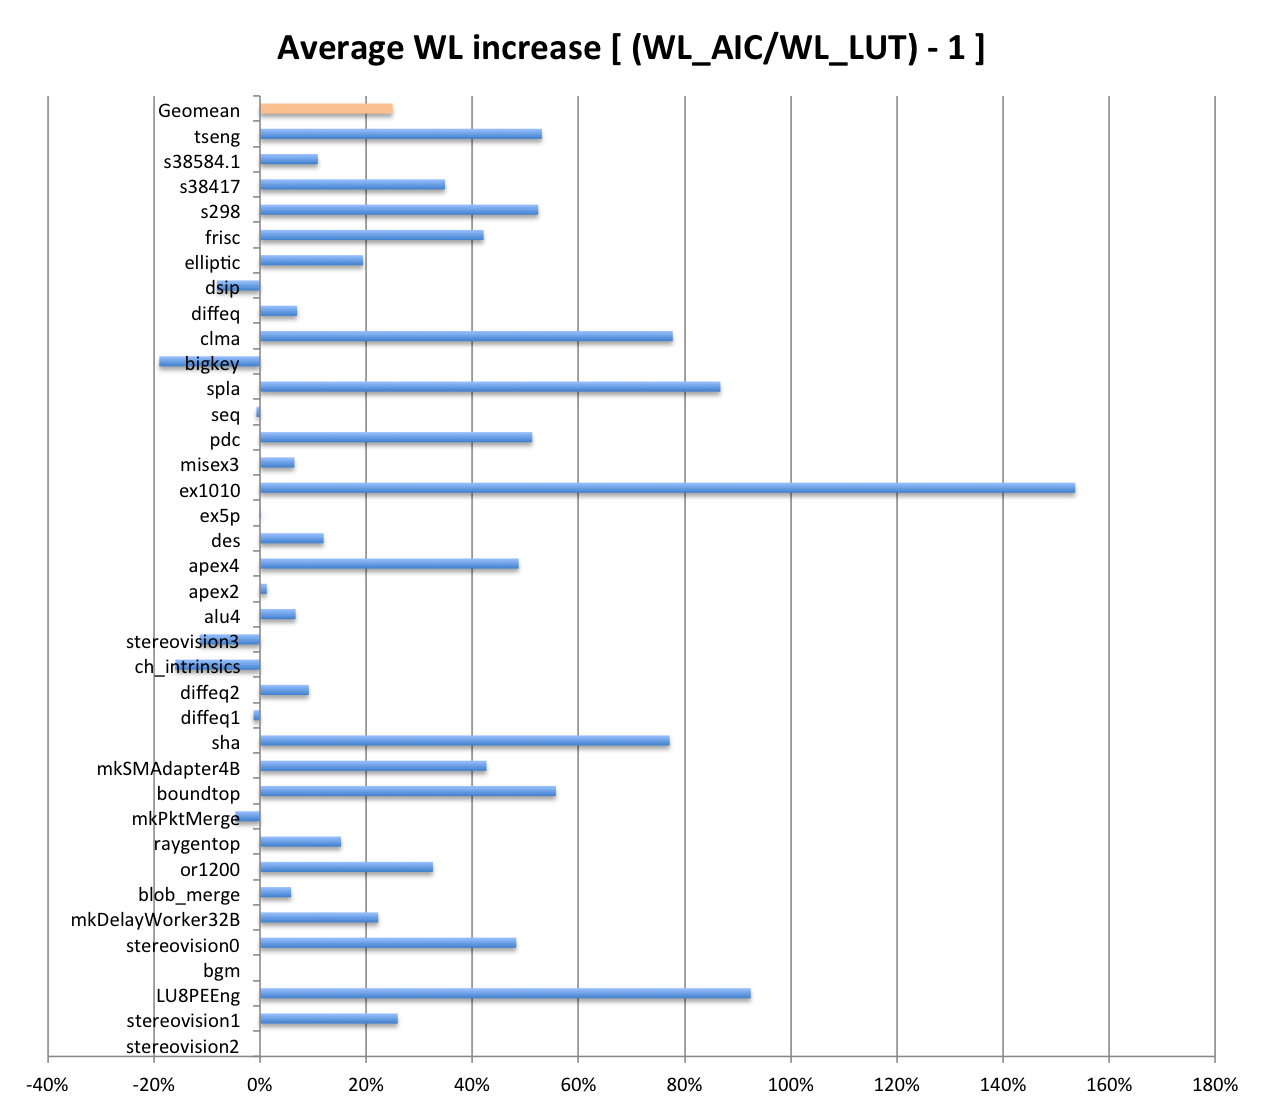
A set of circuits were mapped and P&R using VPR on 2 different architectures: AIC and LUT. The experimental setup is the following:
- 20 MCNC and 15 VPR (all but the 4 largest ones) benchmarks.
- Each architecture was annotated with the delay numbers extracted from the full custom design of the LUT and AIC logic cluster, respectively.
The maximum frequency in the LUT architecture is in average 67% higher than in the AIC architecture:

The delay of the critical paths are distributed between logic (logic + internal routing) and net (external routing) delay as follows:
The average external routing wirelength was increased by 25% in the AIC architecture:
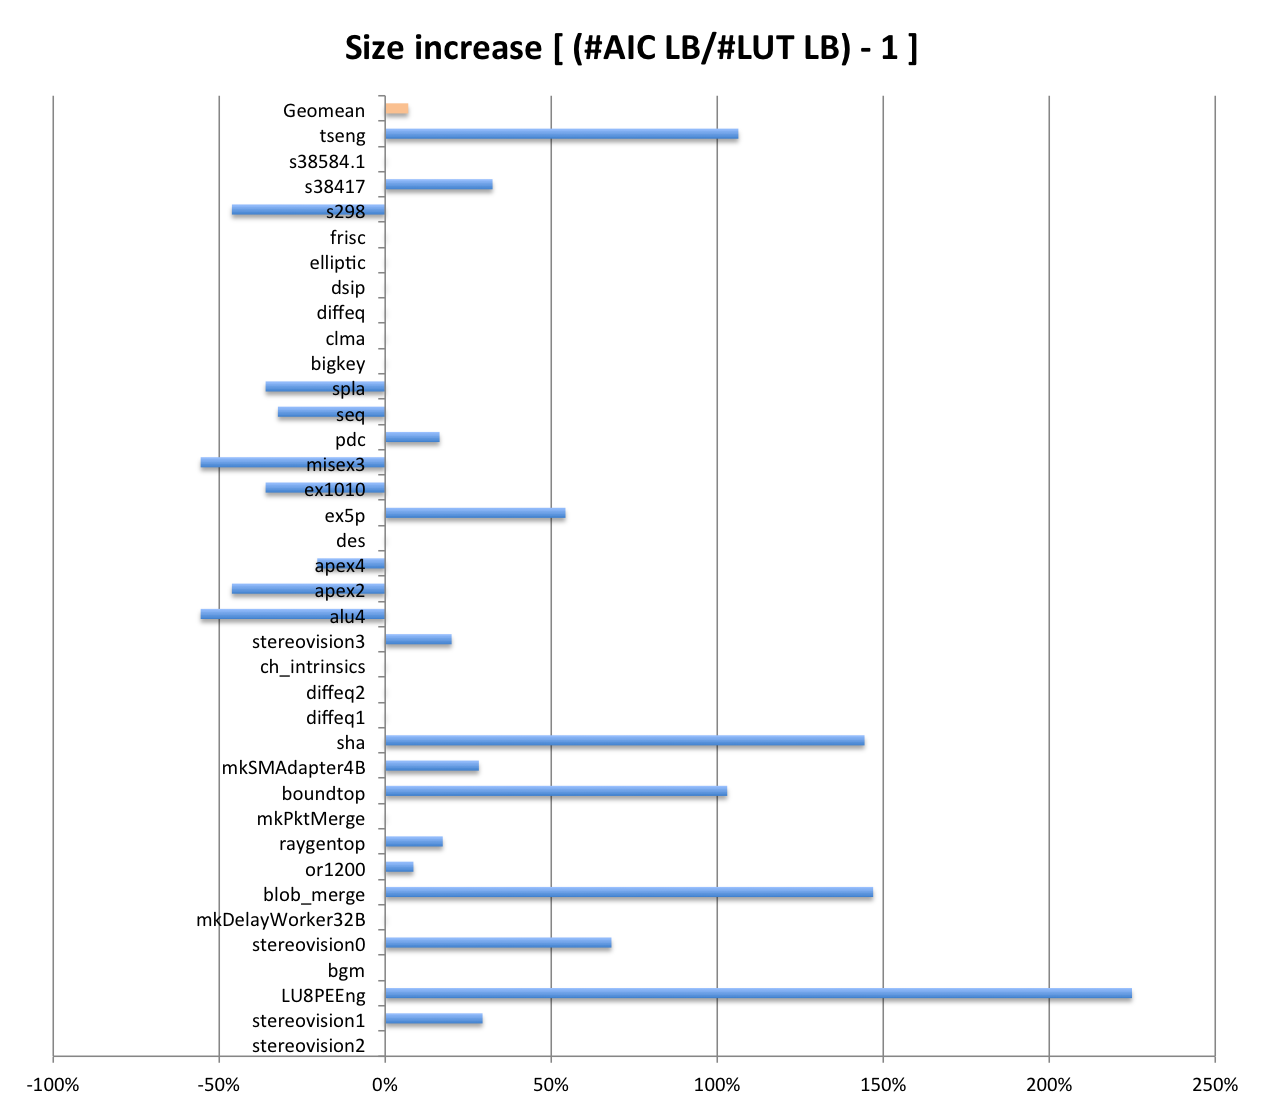
Besides, the AIC architecture requires in average 7% more logic clusters than the LUT architecture:
|
|||||||||||||||||||||||||||||||||||||
|
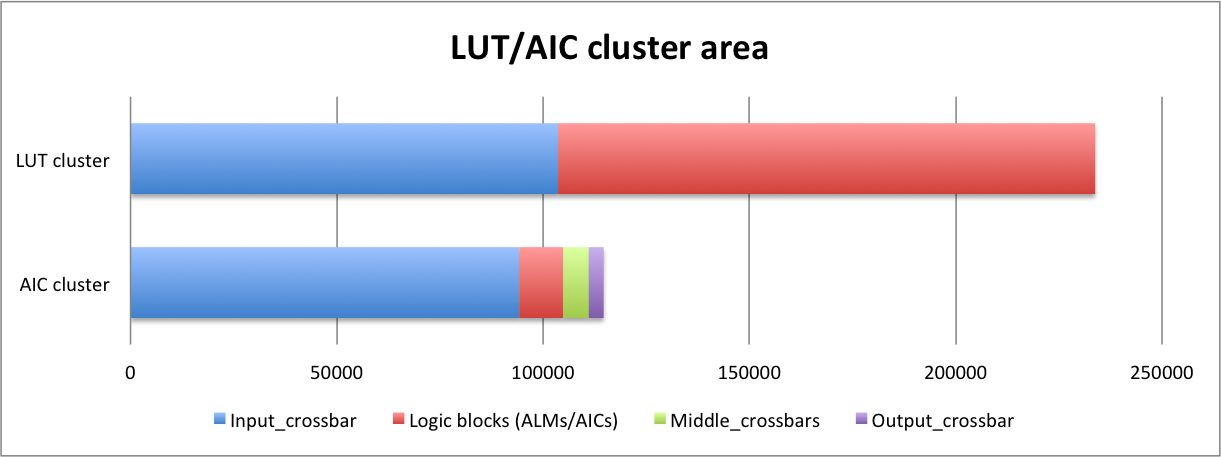
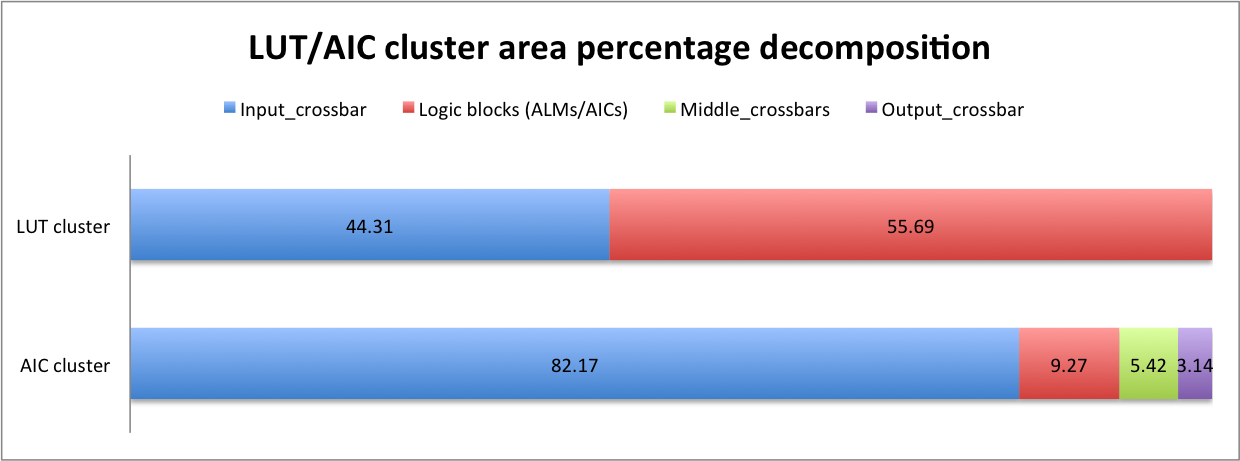
Representation of the LUT/AIC cluster area (IECAS numbers)
The area representation on terms of number of minimum width transistor.
Percentage area decomposition of the LUT/AIC cluster.
|
|||||||||||||||||||||||||||||||||||||
|
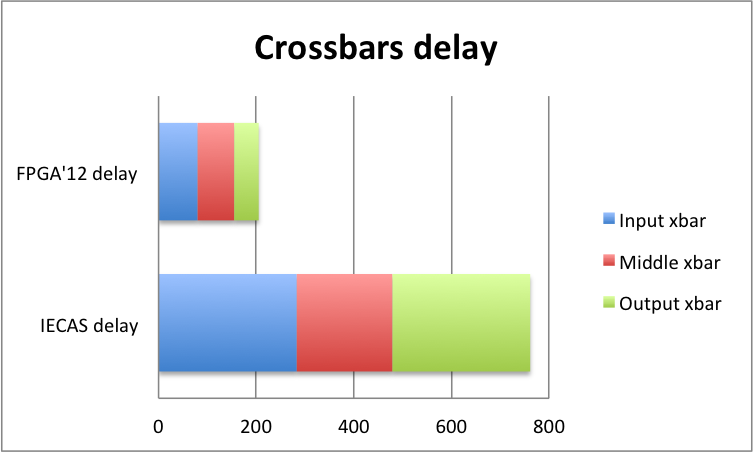
Delay comparison (IECAS vs FPGA'12)
Although the IECAS implementation is in 40nm while the FPGA'12 implementation was using 90nm, the table below lists the delays of each component in the AIC cluster (in ps). The comparison aims at highlighting any striking ratio differences between the two implementations (ex. the crossbars delays).
|
|||||||||||||||||||||||||||||||||||||
|
Delay/Area comparison after optimization
|
|||||||||||||||||||||||||||||||||||||
|
Experiments after design optimization (40nm IECAS delay parameters)
FPGA'12 architecture Vs. Stratix IV
FPGA'12 architecture without the middle crossbar Vs. Stratix IV
[AIC cluster with no middle crossbar and having 4 6-AICs] Vs. [Stratix IV]
|