- français
- English
Lab session and results
The next logical step was to test the prototype in the lab. The goal of the experiment was to measure with our prototype the fluorescence of GFP and the turbidity of some samples on 4 decades.
To do so, we prepared:
- A solution of bacteria expressing GFP
- A solution of bacteria expressing GFP in presence of arsenic. So this is the bioreporter we’d use in the field. However, no arsenic was added as we just wanted to measure the background fluorescence generated by bacteria.
- A solution of LB medium
We measured, with lab equipment, their GFP fluorescence by exciting them at a wavelength of 488nm and by measuring the emission at a wavelength of 525nm. We noted that there was more fluorescence (30561) in the first sample than in the second one (1281) as the first is full of GFP. However, the second sample still has more fluorescence than the background LB medium measure (716), thus indicating that bacteria do indeed slightly fluoresce naturally.
We also measured the absorbance of each sample in order to see the amount of bacteria in each sample. Here are the results:
|
Wavelength: |
GFP |
Bioreporter |
LB |
|
470 |
0.4023 |
0.4589 |
0.0637 |
|
480 |
0.3951 |
0.4445 |
0.0579 |
|
490 |
0.3846 |
0.4342 |
0.0535 |
|
500 |
0.3792 |
0.4273 |
0.0524 |
|
510 |
0.3688 |
0.4190 |
0.0508 |
|
520 |
0.3560 |
0.4090 |
0.0484 |
|
530 |
0.3484 |
0.3984 |
0.0460 |
|
540 |
0.3428 |
0.3940 |
0.0460 |
|
550 |
0.3377 |
0.3862 |
0.0453 |
|
560 |
0.3346 |
0.3812 |
0.0442 |
|
570 |
0.3268 |
0.3719 |
0.0418 |
|
580 |
0.3219 |
0.3666 |
0.0417 |
|
590 |
0.3206 |
0.3622 |
0.0422 |
|
600 |
0.3139 |
0.3564 |
0.0413 |
|
610 |
0.3089 |
0.3518 |
0.0413 |
|
620 |
0.3057 |
0.3470 |
0.0419 |
|
630 |
0.3013 |
0.3409 |
0.0392 |
|
640 |
0.2963 |
0.3361 |
0.0394 |
|
650 |
0.2932 |
0.3320 |
0.0390 |
|
660 |
0.2879 |
0.3268 |
0.0385 |
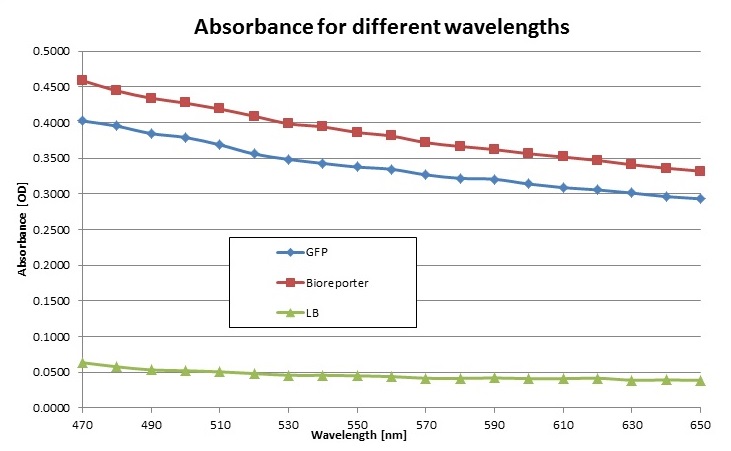
We noticed that the bioreporter sample had more bacteria. So we had to calculate how much of each sample had to be taken in order to have solutions of each sample with the same amount of bacteria. So we took the above results at 630nm (emission wavelength of the red light we use in our prototype) and subtracted the background absorbance (LB) in order to obtain 0.3013 – 0.0392 = 0.2638 OD for GFP and 0.3409 – 0.0392 = 0.3051 OD for the bioreporter. The bioreporter sample has thus 0.3051/0.2638 = 1.15 more bacteria than the GFP sample.
Having 4ml vials, we prepared a first solution for GFP containing 2ml of the bacteria and 2ml of LB medium. To have the same concentration of bioreporter bacteria, we prepared a solution for the bioreporter containing 2*1.15 = 2.3ml of the bioreporter bacteria and 1.7ml of LB medium.
Having our two main solutions with the same amount of bacteria, we did a four decade dilution of each. To do so we followed these steps:
- Take 0.4ml of your GFP solution and dilute it in 3.6ml of LB. This solution is thus a 10x dilution.
- Vortex this new solution.
- Take 0.4ml of this solution and dilute it in 3.6ml of LB. This solution is thus a 100x dilution.
- Continue this way until you have a total of 5 solutions:
- The main solution i.e. the most concentrated
- 10x dilution solution
- 100x dilution solution
- 1000x dilution solution
- 10000x dilution solution
- Repeat all the above steps for the bioreporter solution. You should thus have a total of 10 solutions at the end.
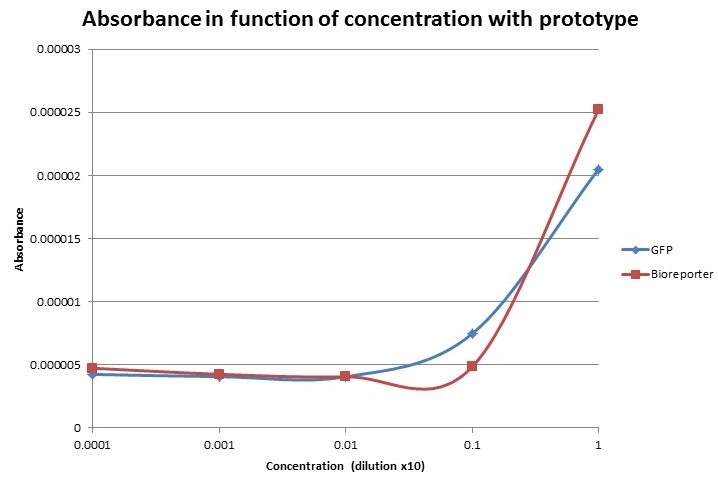
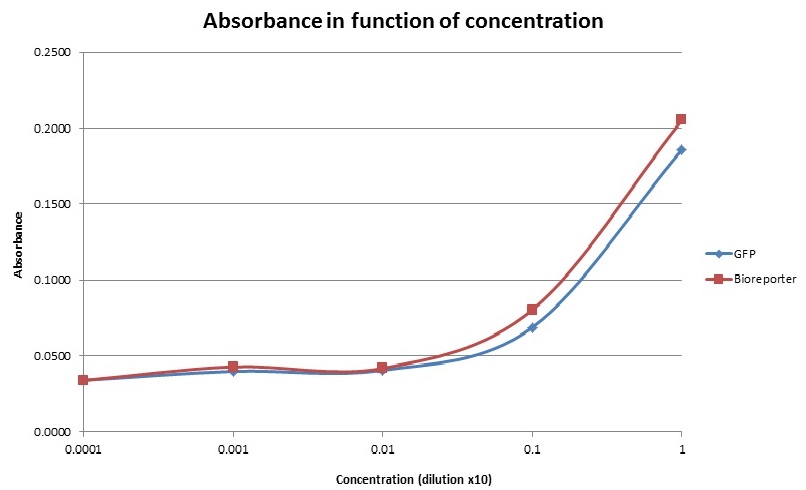
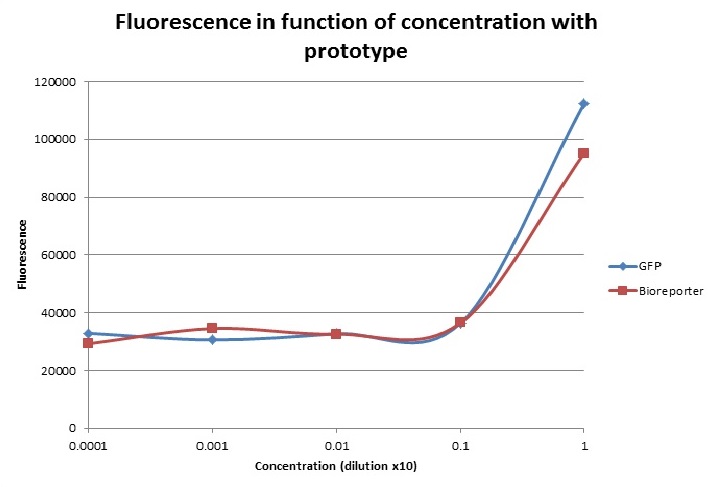
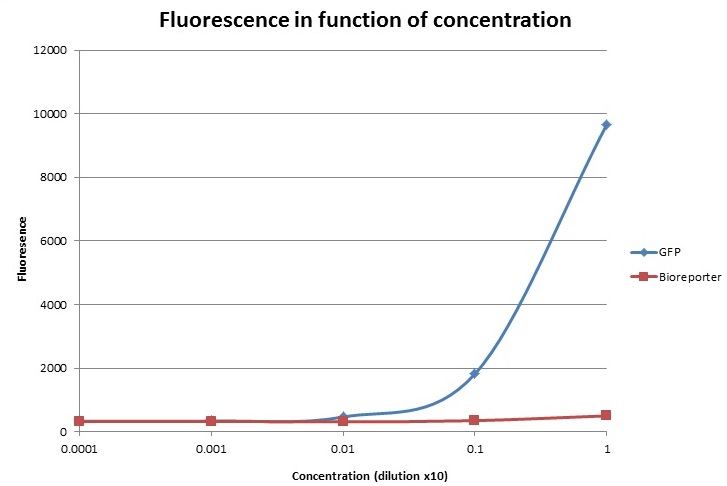
Below, you can see the results that we have obtained for the absorbance and the fluorescence for our prototype compared to the true values measured by the lab equipment. (1 indicates the most concentrated solution, 0.1 the 10x dilution, 0.01 the 100x dilution etc…).
For the absorbance, as our prototype measures the turbidity, we have to inverse the obtained values by the prototype in order to correlate them with the others. Indeed the absorbance is a measure that indicates the amount of bacteria in the sample. In our prototype, we detect the light of the red LED that goes through the sample, so the more bacteria there are (so the higher the absorbance); the less light will be detected. At the end, we can observe that the two curves have the same shape and there is only one point which doesn’t correlate with the lab results. Let’s note that there’s no unit of absorbance for the prototype yet which means that we can’t compare the results amplitude wise.
For the fluorescence, let’s first note that our prototype seems to have background fluorescence at roughly 3000. Indeed, for very small dilutions, this background is always present. Where does this come from? We think that the light from the blue LED might manage to reach the detector without passing through the sample. So even though our sample would contain just plain water, light would still reach the detector. To fix this we should add some sort of cardboard which would only let light emanating from the sample reach the detector.
One other notable result is that our prototype detects much more fluorescence in the most concentrated bioreporter solution than the lab equipment. Which isn’t normal, indeed this solution contains very little GFP (at least compared to the most concentrated solution of GFP). So where is this false result coming from? It might be because of the fact that the solution contains a relatively high amount of bacteria; these particles might reflect the light coming from the LED onto the detector. We’re not too sure about this and thus further investigations in future tests should be done.
In general, we can conclude that we’ve probably diluted our samples too much. Indeed, when the dilutions are over 100x, both the prototype and the lab tests fail to detect a difference! What does this mean? Well, that we should’ve prepared initial solutions with more bacteria before doing the dilutions. Because of this mistake, our results are partially inconclusive.
Next time, one should test the prototype with higher amounts of bacteria in order to get some concise results. If the results are then not precise, one could consider getting a more precise photo sensor.