
- français
- English
First experiment
The goal of this experiment was to apply the protocol and also to get familiar with it.
Moreover we wanted to compare the LSS mOrange and eGFP relative fluorescence as a function of the arsenic concentration.
The relative fluorescence is the fluorescence divided by the absorbance. We use this value, because it removes the impact of light absorption by bacteria.
To perform the following experiments, we used this protocol (that we have also adapted to LSS mOrange).
Here are the results we got for the eGFP protein :
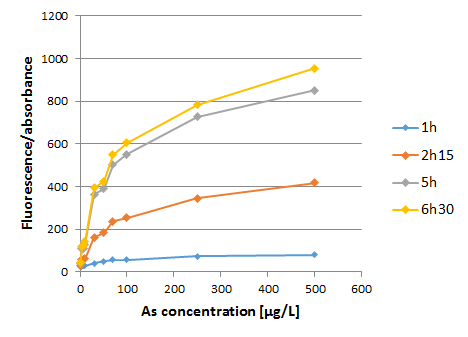
Figure 1: Relative fluorescence of eGFP in function of different Arsenic concentration after 1, 2.25, 5 and 6.5 hours of incubation.
The relative fluorescence increases linearly between 0 and 100µg/L of arsenic concentration and then reaches a plateau. Moreover it increases with the incubation time.
Analysis of the results : Bacteria need time to grow and become fully active, as well as eGFP needs time of maturation. This is why we note that the relative fluorescence increases with time.
We also find that with the time and the increasing of arsenic concentration, bacteria produce more eGFP proteins, especially in the range of arsenic concentration between 0 and 100µg/L. Afterwards, the fluorescence curve seems to tend to a maximum because the bacteria cannot produce an infinite number of arsenic receptor, the protein which is coupled with eGFP protein.
Here is the result we got for LSS mOrange :
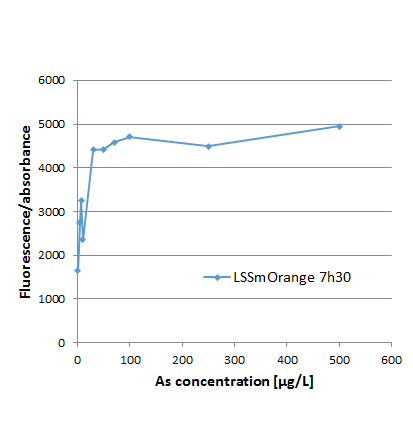
Figure 2: Relative fluorescence of LSS mOrange in function of different Arsenic concentration after 7.5h of incubation.
The relative fluorescence increases linearly between 0 and 100µg/L of arsenic concentration and then reaches a plateau.
The curve is not as smooth as the previous one, because the relative fluorescence is based on one set of measurement instead of three.
This result is not easily analyzable, because we need more precise measurements.