
- français
- English
Performance evaluation
To assess its quality, the GIF model myGIF (previously fitted to the training dataset of myExp) can be used to predict the spikes of the test dataset. For that, the following command can be used:
myPrediction = myExp.predictSpikes(myGIF, nb_rep=500)
where the parameter nb_rep defines the number of times the GIF model myGIF is stimulated with the test set current (remember that the GIF model is stochastic). This function returns an object myPrediction of the class SpikeTrainComparator. This object can be used to:
1. Compute the spike-train similarity measure Md (Naud et al. 2011) between the spiking data and the model prediction
For that, call the following function
Md = myPrediction.computeMD_Kistler(4.0, 0.1)
where the first parameter specifies (in ms) the half-width of the Kistler coincidence window (see Pozzorini et al. 2015) and the second parameter (in ms) defines the temporal granularity used to discretize the spike trains. To speed up calculations, this temporal granularity can be slightly larger than the inverse of the experimental sampling frequency.
2. Visualize the test data set and the GIF model prediction (raster plot and PSTH)
For that, use the following function:
myPrediction.plotRaster(delta=1000.0)
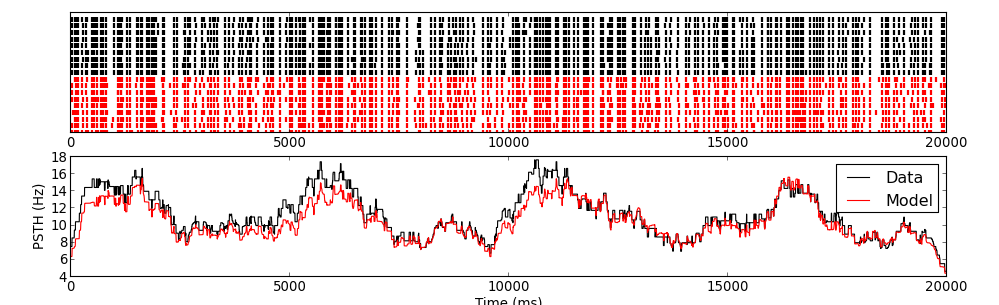
The parameter delta defines (in ms) the size of a rectangular sliding window used to compute the experimental and the predicted PSTH (see Figure, bottom panel).
Go back to the homepage.