|
Navigation
 This wiki
This page This wiki
This page
|
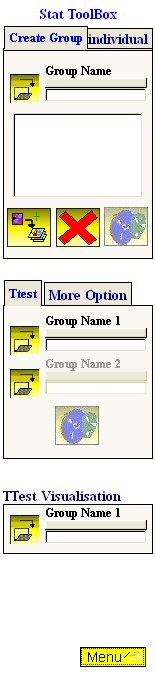
If you click on The statistical tool box is divided into three steps : 1. Create Groups : Compute mean and var images of a group of individual 2. Ttest Computation : Compute t-test between two groups 3. Ttest Visualisation : To visiualize t-test between two groups
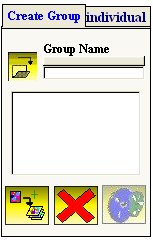
1. Create Groups The fisrt step to compare groups of brain is to compute mean and var images of a group. To do so, use the following option :
First create a new directory for the mean and variance images as for exemple : Ttest/AC-OLP and give a name to the group, for example AC Then load images using the button Four images will be created : AC-MeanImage.mhd + AC-MeanImage.raw and AC-VarImage.mhd + AC-VarImage.raw A file which contains the number of individual in the groups is also created : AC-NumberOfIndi.txt
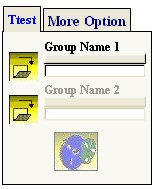
2. Ttest Then once you have computed the mean and var images of two groups you can compare them using the option ttest :
First load the Mean image of group 1, for example AC-MeanImage.mhd Then load the Mean image of group 2, for example D1-MeanImage.mhd press the compute button Ttest/AC-OLP_vs_D1-OLP and called the image AC-OLP_vs_D1-OLP.mhd Three image are created : 1. Mean image of both groups : AC-OLP_vs_D1-OLP-MeanIm.mhd 2. Positive Result of ttest which means AC vs D1 : AC-OLP_vs_D1-OLP-Pos.mhd 3. Negative Result of ttest which means D1 vs AC : AC-OLP_vs_D1-OLP-Neg.mhd A file with the total number of individual is also created to determine the degree of freedom for the t-test visualisation.
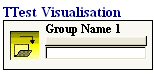
3. Ttest visualisation If you want to visualize results of groups comparison, use the following option :
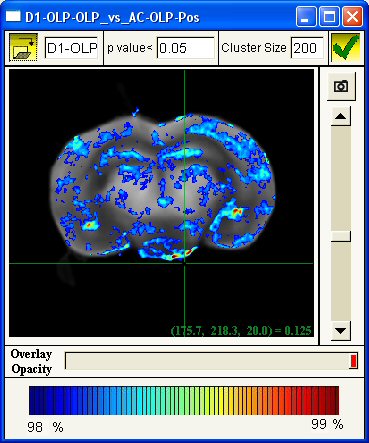
Click on the load button, first load the mean image of both group. For example : AC-OLP_vs_D1-OLP-MeanIm.mhd then load the positive or negative ttest test for example AC-OLP_vs_D1-OLP-Neg.mhd. The following window appear :
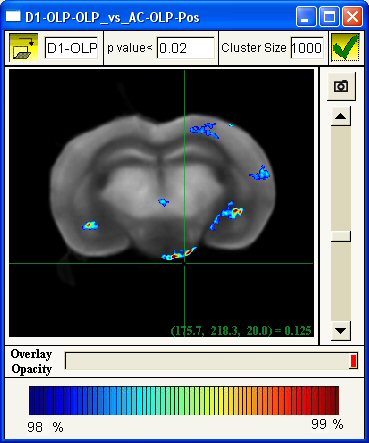
To change the p value use the p value window. For example instead of 0.05, use 0.02, press the ok button,
It the same principle with the cluster size option, instead of 200 use 1000, then press the ok button,
|
Share |